Bitcoin Value Area Trading Strategy: Wait for Confirmation
Bitcoin stayed above its prior value area, so Fahad treated $84,400 and $84,700 as conditional short setups, not automatic entries.
8 min read
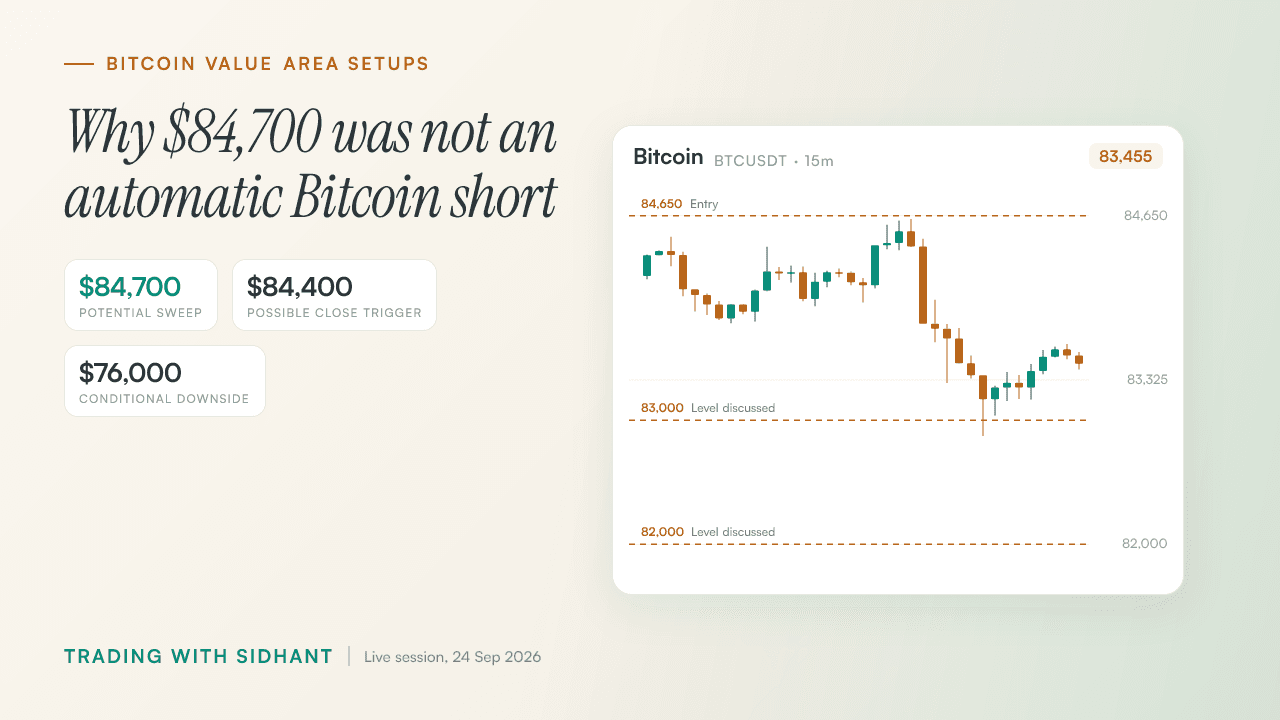
Bitcoin had a possible short area near $84,700, but Fahad would not short it on a touch. On the stream, price was still above the previous range's value area, leaving the bullish case open despite his bearish lean. Our bitcoin value area trading strategy discussion came down to this: a marked level gives us a place to watch, not a trade. Fahad also watched for a close below $84,400. He gave no stop or intraday target for either idea.
Key Takeaways
- A bearish bias stayed conditional while Bitcoin traded above the old value area and major support remained part of the picture.
- The sweep and the close were separate conditions; neither supplied a complete trade plan on its own.
- A trapped trader was evidence to examine, not an entry signal to obey.
- The validity of the setup came before the size of its stop or the strength of Fahad's bearish view.
- Reaching TP1 created a management decision; silver's breakeven outcome did not dictate oil's next stop adjustment.
Bitcoin above its previous value area still had a bullish case
Bitcoin remained above the previous range's value area during Fahad's analysis, so his bearish view had a limit: the bullish case was still possible. We kept the $82,000 to $83,000 support zone separate from acceptance back inside old value. Neither a touch of support nor a brief move toward the prior range established that acceptance.
Support was still in the picture. Fahad marked $82,000 to $83,000 as major support where former resistance had flipped. About $81,000 mattered as a breakout area in his prior-range discussion, but he did not give the value area's exact high and low. We cannot use either nearby level as an invented boundary.
Fahad's Bitcoin level map and the condition attached to each area
| Level or area | Role in the analysis | What remains unconfirmed |
|---|---|---|
| $82,000 to $83,000 | Major support where former resistance had flipped | A sustained loss of support |
| About $81,000 | Breakout area in the prior-range discussion | Acceptance back inside the previous value area |
| $76,000 to $76,500 | Possible broader downside area after acceptance inside previous value | The acceptance needed for that scenario |
A move through a level is not the same as continued trading inside an old range. Fahad attached the possible move toward $76,000 to $76,500 to acceptance inside the previous value area. We did not treat it as an intraday short target.
A separate report on Bitcoin's $82,000 rejection described a rejection, not the value-area acceptance Fahad was discussing. Our Bitcoin resistance and order-flow discussion covers why we still watch how price responds at a marked level.
The $84,700 sweep and $84,400 close were conditional short setups
Fahad watched two possible Bitcoin shorts: a sweep near $84,650 to $84,700, or a close below $84,400. We treated them as separate conditions, not automatic entries. The range remained unresolved, and Fahad gave no exact stop or intraday target for either idea. The $84,430 daily-candle wick added context to the lower level.
The tests were different. For the sweep idea, Fahad wanted to see price run through the area of interest before considering a short. The other idea required a close below $84,400, not just a dip under it. Neither condition was reported as an executed trade.
The two Bitcoin short ideas Fahad watched
| Setup | Level | Condition | Missing trade detail |
|---|---|---|---|
| Potential liquidity sweep | $84,650 to $84,700 | Sweep the area before considering a short | No stated stop or intraday target |
| Possible breakdown | Below $84,400 | Close below the level | No stated stop or intraday target |
The chart below marks $84,650, $84,700 and the nearby $84,430 wick. Those are discussed levels, not proof of an entry. We left $76,000 to $76,500 out of the setup table because Fahad tied that broader area to acceptance inside the previous value area.
Our Bitcoin pullback and liquidity-sweep discussion looks at the price response a sweep needs. The BTC futures ideas listing is a collection of ideas, not evidence that Fahad entered either short.
◆ Interactive Lab
Open in new tab ↗Drive the order book yourself
A trapped buyer needs a key level and a structure shift
Trapped buyers near a candle high did not, by themselves, give us a Bitcoin short. Fahad showed that traps can appear at ordinary points on a chart. We wanted to see one at a meaningful level, followed by a market-structure shift or another confirmation. Order-flow tools could help us examine that sequence, not replace it.
Location filtered the signal. Fahad pointed out trapped buyers near candle highs and trapped sellers near candle lows. Would we short every candle showing trapped buyers? No. A trap away from a marked level gave us less to work with.
Fahad put it plainly: 'That trap alone cannot be a trigger to get into a trade. You need some kind of market structure shift, some kind of confirmation.' We took three checks from his explanation:
- Meaningful location: Mark the level before judging the trap.
- Trapped-side evidence: Look for buyers caught near a high or sellers caught near a low.
- Confirmation: Wait for a market-structure shift or another clear price response.
Fahad discussed TPO, Footprint, Balance, CVD and open interest as context when price action offered little structure. He said his level reading came mainly from experience watching candles form, rather than an indicator issuing instructions. Our Footprint order-flow guide covers the data; on the stream, Fahad still required location and confirmation before acting.
An unresolved Bitcoin range made waiting part of risk control
Fahad expected Bitcoin to move lower but advised against trading while its current range remained unresolved. We treated waiting as a risk decision. A small stop offered no advantage if its placement did not fit the setup, and a visible trap could not make an unconfirmed trade valid. His directional view alone was not enough.
No confirmation, no forced trade. Fahad preferred to let the market progress rather than enter inside the range on a bearish view. A busy chart can offer plenty to watch without giving us a reason to put on a position.
He put the stop question plainly: 'The point is whether it is a logical SL or not? That is the first thing and second is whether that trade is valid or not.' We had to judge the trade and its stop together. A tight stop that price can hit without disproving the idea solves nothing.
For a further short idea, Fahad said he would risk only a percentage of profits. He specified no percentage, entry or stop, so we could not infer a position size. Our Bitcoin range-trading discussion addresses defined setups inside a range; Fahad was still waiting for one here.
Silver and oil reached TP1, but called for different next steps
The earlier silver trade reached TP1 and then reversed. Traders who had moved the remaining position's stop to breakeven could exit that portion without a loss. Oil reached TP1 on the stream too, but Fahad told viewers to book some quantity and wait a little before moving its stop to breakeven. We kept those decisions separate.
The first target did not dictate the next stop. Fahad described the silver opportunity as roughly 1:2 risk-to-reward, without stating its exact entry or TP1 price. Its reversal showed how a breakeven stop could protect the remainder in that trade. Oil had reached the same milestone, but Fahad did not call for an immediate stop change.
How Fahad discussed managing silver and oil after TP1
| Market | Reported outcome | Management discussed | Prices not stated |
|---|---|---|---|
| Silver | TP1 reached, then price reversed; opportunity described as roughly 1:2 | A breakeven stop protected the remainder from a loss | Exact entry and TP1 price unspecified |
| Oil | TP1 reached on the stream | Book some quantity; wait a little before moving the stop to breakeven | Exact entry and TP1 price unspecified |
When oil hit, Fahad said, 'We're at the TP one, boys and girls, on the oil trade.' He was pleased, but he distinguished taking partial profit from moving the stop. The chart below marks a separate $92.00 to $92.20 pullback discussion and the $100 level. It does not establish the live trade's entry or TP1 price.
Our trade exit strategies discussion covers the choice between taking profit and adjusting a stop. On this stream, Fahad reported two first targets and discussed different next steps for each.
◆ Interactive Lab
Open in new tab ↗Drive the order book yourself
Fahad's bearish Bitcoin view never became a reason to short the unresolved range. He had levels to watch and order-flow clues to examine, but we still needed a price response before treating either short idea as a trade. The silver and oil updates made a related point: reaching a first target did not produce the same stop decision in both markets. We can mark $84,700 and $84,400 precisely while leaving the entry, stop and outcome open where the stream left them open. Join the Hitpoint community for live market coverage and real-time trade alerts.
Watch the full stream: Bitcoin Value Area Trading Strategy: Wait for Confirmation on YouTube
Disclaimer: This article is for educational purposes only and is not investment advice. The price levels, setups and trades described are a review of market events that have already occurred, shared to illustrate a method of analysis rather than to recommend any trade. Trading With Sidhant LLP is not a SEBI-registered Investment Adviser or Research Analyst, and nothing here constitutes a recommendation to buy or sell any security. Investments in securities markets are subject to market risks; read all the related documents carefully before investing. Past performance is not indicative of future results. Please consult a SEBI-registered financial adviser before acting on any information in this article.
Frequently Asked Questions
- What happens if Bitcoin moves back inside its previous value area?
- Acceptance back inside the previous value area would strengthen the broader downside case Fahad discussed on the stream. He identified **$76,000 to $76,500** as a possible area in that scenario, not as the target for either intraday short idea. Bitcoin was still above old value during the analysis, so a momentary move toward it would not establish acceptance.
- Why was the $84,700 Bitcoin sweep not an automatic short?
- The **$84,700** area was a place where Fahad wanted to watch for a sweep, not a price at which he reported entering short. The current range remained unresolved, and he wanted a useful response from price before treating the idea as a valid setup. He gave no exact stop or intraday target for it.
- What confirmation should follow trapped buyers before a short?
- A **market-structure shift** or another clear confirmation should follow trapped buyers at a meaningful level before Fahad would treat them as a short trigger. He pointed out that trapped buyers can appear near candle highs anywhere on a chart. We gave a trap at an ordinary location less weight than one at a level marked in advance.
- Should traders short Bitcoin while its current range is unresolved?
- Fahad advised against forcing a Bitcoin short while the range remained unresolved. He leaned bearish but watched for a sweep near **$84,650 to $84,700** or a close below **$84,400** instead of acting on direction alone. Neither condition was reported as an executed trade, and he supplied no exact stop for either idea.
- What can the silver and oil TP1 outcomes teach about managing a trade?
- Taking partial profit and moving a stop were separate decisions in Fahad's silver and oil updates. Silver reached TP1, reversed, and left traders who had moved the remainder's stop to breakeven able to exit that portion without a loss. Oil also reached TP1, but Fahad discussed booking some quantity first and waiting a little before moving its stop to breakeven.
Share this post

Price Action Pullback Trading Strategy: The 1:2 Rule
The video turns a pullback into a trade plan: find at least two aligned levels, wait for confirmation, and target 1:2.
What Bitcoin Negative Delta and Rising OI Mean
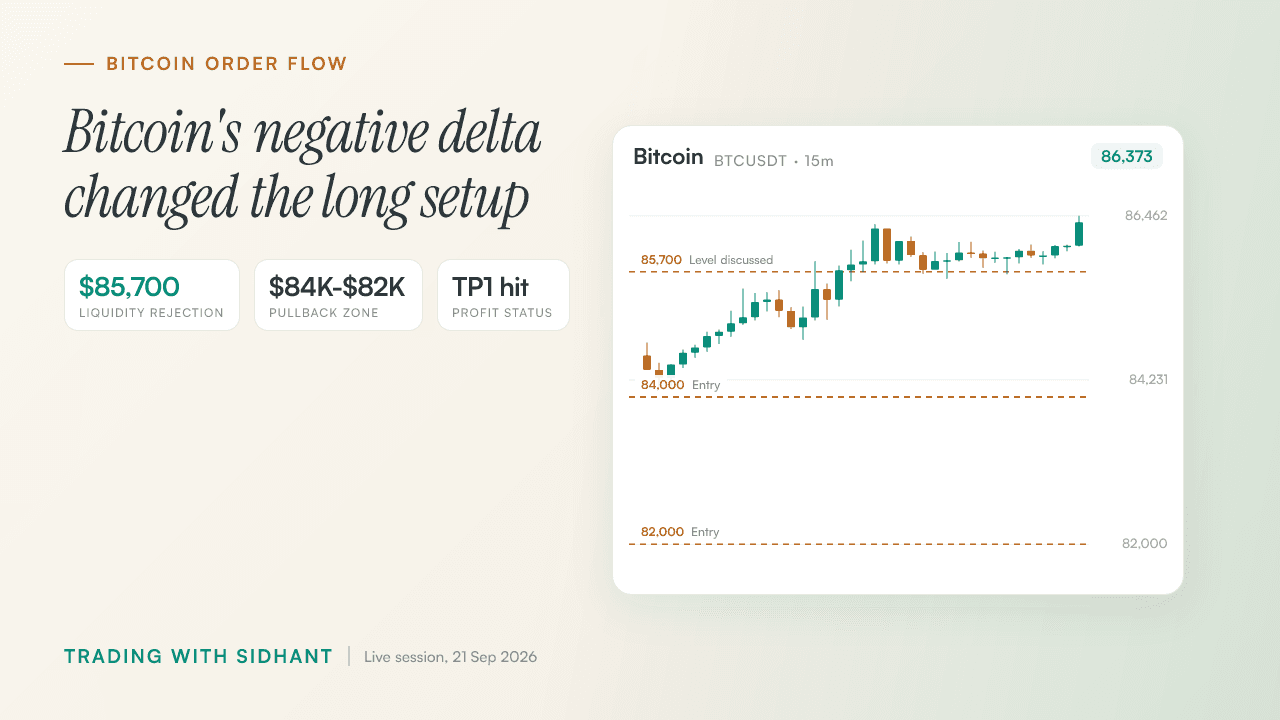
Bitcoin rejected $85,700 liquidity, but negative delta and rising open interest kept the upside case alive.

Pin Bar Trading Strategy for Crypto: Entry Rules
A $700 result led into a three-step crypto setup built on direction, area and a pin-bar break.
Get post alerts in your inbox.
New blog post? We'll email you. No spam, unsubscribe anytime.
Join our Telegram community.
Get post alerts, trading discussions, and market updates.