Bitcoin Order Flow Analysis After a Rally
Bitcoin had already rallied, so Fahad used 80,400, delta and seller exhaustion to explain why waiting beat a FOMO entry.
7 min read
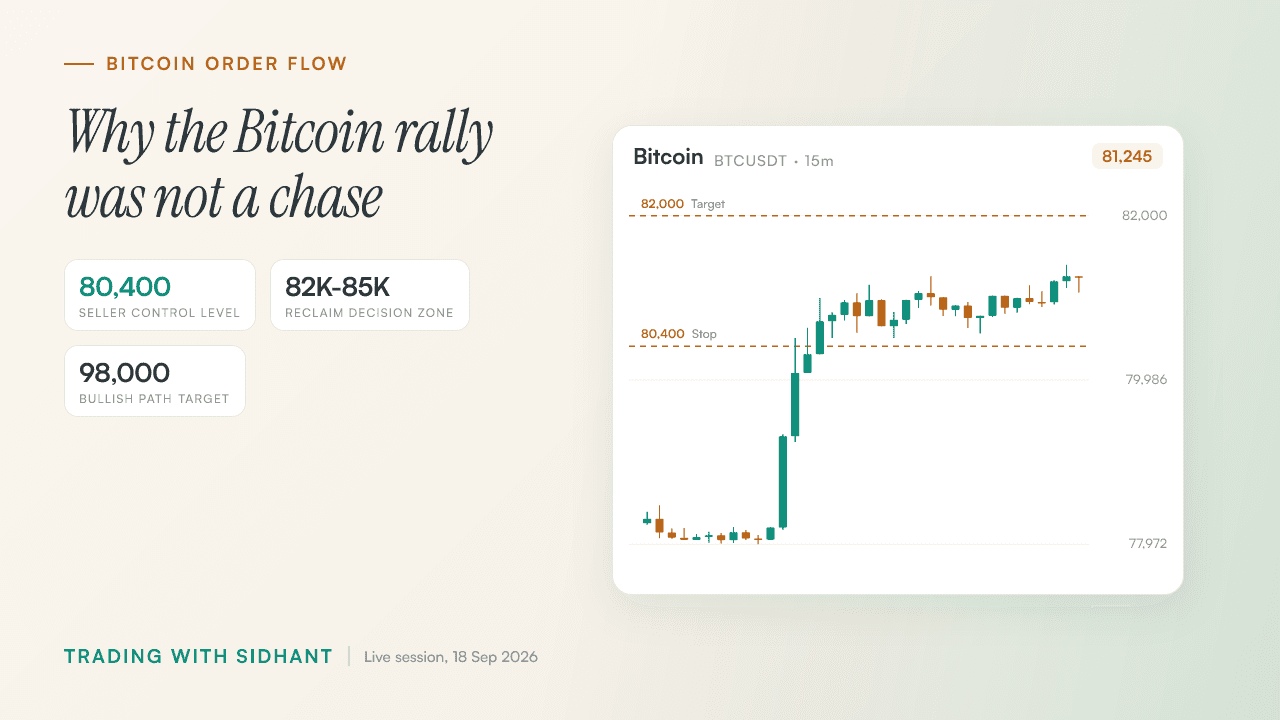
BTC had already made its clean push before we got into the trade discussion. That changed everything. Our bitcoin order flow analysis after a rally was not about finding a late entry for restless traders. It was about spotting where the move had spent its easy momentum. Fahad marked 80,400, 81,749, and the wider 82,000 to 85,000 decision band, then refused to chase. As he put it, 'I can wait for some structure to be formed here, some range to be formed, some liquidity to be built up.' That patience was the trade idea.
Key Takeaways
- After a sharp BTC move, wait for structure and liquidity instead of paying peak price for a FOMO entry.
- A reclaim only mattered after BTC held above the zone on higher timeframes, not when price briefly wicked through it.
- Seller exhaustion can fuel a rally, but delta, open interest, CVD, and liquidity must agree before calling it confirmed buyer control.
- The 80,400 condition gave the team a decision point, while single prints required confirmation from broader order flow.
- A stop-out should trigger a review of execution, not revenge trading in a low-volume market.
Bitcoin had already rallied, so chasing offered poor risk
Fahad avoided a late BTC long because the initial push had already happened before the stream, leaving poor risk for anyone entering on excitement. We treated 81,749 and the wider 82,000 to 85,000 band as decision areas rather than automatic entries, waiting for fresh structure, a range, and rebuilt liquidity.
The chart below marks the BTC levels discussed on the stream, including 80,400, 81,749, and 82,800. A rally that has already run does not owe anyone a second clean entry.
Before any fresh idea, we wanted:
- Structure: price had to stop sprinting and show a readable sequence.
- Range: price needed time to build acceptance instead of printing one-way candles.
- Liquidity: positioning needed room to develop before a directional move meant much.
Fahad was blunt. He was not going to be one of those 'Trader Joe's' entering after the market had already pushed. For a deeper framework on waiting for defined conditions, see our guide to Bitcoin range trading with small risk.
Bitcoin levels and what each scenario required
| Price area | Market condition | Trading implication |
|---|---|---|
| 80,400 | 15-minute close below the level | Sellers regained control in Fahad's framework |
| 81,749 | Marked decision level | Required a reaction, not blind chasing |
| 82,000 to 85,000 | Sustained reclaim and acceptance | Kept the bullish continuation case alive |
| 98,000 | Daily or weekly acceptance above the reclaim zone | Upside path Fahad outlined |
◆ Interactive Lab
Open in new tab ↗Drive the order book yourself
The 82,000 to 85,000 band decided the 98,000 or downside case
We framed 82,000 to 85,000 as BTC's make-or-break area. Daily or weekly closes above that band could support a path toward $98,000, while rejection and distribution below it kept $57,000 to $59,000 and an ambitious $48,000 to $49,000 ultimate-bottom scenario in view.
A reclaim needs acceptance, not a brief wick. Fahad's point was simple: 'If Bitcoin goes above this, it starts closing above it. Then it is perfect. You're going to see a 98K.' The key was price beginning to close above the zone.
Daily and weekly timeframes mattered because a fast intraday poke into resistance proves little. Price had to spend time above the band and show that sellers were no longer controlling it.
- Above 82,000 to 85,000: sustained acceptance supported Fahad's route toward $98,000.
- Rejected below the band: distribution kept $57,000 to $59,000 on the board.
- Hard failure: Fahad said $48,000 to $49,000 would be ambitious, but not shocking after rejection.
The chart below shows WTI's 15-minute movement from the same session window. It supported the point made on the stream: cross-market activity alone did not explain BTC's move.
A separate Bitcoin resistance and order-flow breakdown explains why acceptance at resistance matters more than a single breakout candle. External market commentary also described BTC stalling near $81,455, which fit the resistance context we tracked on the stream Bitcoin pushed to $81,455, but the rally stalled.
Exhausted sellers explained the rally better than a crude oil story
Bitcoin's upside move matched Fahad's reading of aggressive sellers becoming exhausted more than a crude-oil-expiry explanation. Delta, open interest, CVD, long-short ratios, and liquidity need to be read together because one print cannot prove absorption, trapped buyers, or a lasting directional move.
A viewer linked the BTC move to crude oil expiry, and Fahad rejected that explanation. Sellers had pressed the market, failed to extend it, and lost force before price pushed higher.
He also rejected the claim that buyers were clearly trapped. Delta was not strong enough to call it a buyers' market, so the condition was neutral, not confirmed buyer absorption.
| Signal | What Fahad looked for | What it did not prove alone |
|---|---|---|
| Delta | Whether aggressive buying or selling had force | A confirmed buyers' market |
| Open interest | Positioning changes around the move | Exact trader intent |
| CVD | Persistent market-order pressure | A durable trend by itself |
| Single prints | Areas price could revisit or fill | A random entry trigger |
| Liquidity | Where stops and resting interest may sit | Absorption without confirmation |
The distinction was:
- Seller exhaustion: aggressive sellers pressed, then could not keep price lower.
- Absorption: passive liquidity absorbed aggression and needed more proof.
- Neutral conditions: mixed data, with no confirmed buyer control.
- Underwater sellers: shorts sat in negative PNL above their entry without being stopped out or liquidated.
Underwater does not mean liquidated. It means traders remain stuck and exposed to pressure. Our piece on open interest and trapped Bitcoin sellers covers that positioning read in more detail.
◆ Interactive Lab
Open in new tab ↗Drive the order book yourself
A close below 80,400 would put sellers back in control
A 15-minute close below 80,400 would favour sellers again in Fahad's BTC framework. We used that price as a condition rather than a prediction, because BTC could remain neutral after a rally until price, delta, liquidity, and positioning confirmed a directional shift.
A level is useful only when it changes the trade decision. At 80,400, a close below shifted the short-term read toward sellers. Holding above it did not automatically create a long setup.
We also spotted single prints below BTC. Fahad expected that area could be tapped or filled, but warned viewers not to trade single prints randomly. A profile feature is context, not a button to press.
Use single prints with a full process:
- Mark the area and wait for price to interact with it.
- Check liquidity, delta, and market structure around the test.
- Define what proves the idea wrong before entering.
That separates reading a liquidity sweep from guessing at one. Our guide to Bitcoin pullbacks and liquidity sweeps follows the same logic.
The stop-out reinforced why execution beats forced trades
Fahad acknowledged that the BTC stop-loss placement was wrong after price pushed in the expected direction, but we did not answer that frustration with another forced entry. Friday volume was drying up, setups were unclear, and the initial move had already happened, making a flat position the disciplined choice.
'Wow bro, I mean you just had to stop me out and then after that it had to push.' Fahad then corrected himself: the stop placement was his mistake.
A correct directional read with poor execution can still produce a loss. By the later part of Friday, the market was largely dead, which led to Fahad's line: 'Market is not marketing.'
Execution checklist:
- Setup quality: Was there fresh structure, or had the move already played out?
- Stop placement: Did invalidation sit beyond normal noise?
- Willingness to stay flat: Was there a reason to trade beyond boredom or frustration?
'Learning does not make money. Execution makes money in trading.' Study gives traders a map, but repetition under pressure decides whether they can follow it. That is why we keep returning to quality over quantity in trading, especially in slow Friday conditions.
The strongest lesson from this stream was not a BTC target. It was the discipline behind refusing a bad entry. Fahad gave the market room to prove itself around 80,400 and 82,000 to 85,000, then read the order flow as seller exhaustion within neutral conditions rather than inventing certainty from a slow Friday tape. Staying flat after a stop-out is often the better decision when volume is fading and no clean setup remains. Join the Hitpoint community for live market coverage and real-time trade alerts.
Watch the full stream: Bitcoin Order Flow Analysis After a Rally on YouTube
Disclaimer: This article is for educational purposes only and is not investment advice. Crypto assets are unregulated in India, are highly volatile, and can lose value rapidly; there is no established investor-protection or grievance-redressal mechanism for them. Trading With Sidhant LLP is not a SEBI-registered Investment Adviser or Research Analyst, and nothing here constitutes a recommendation to buy or sell any asset. Income from virtual digital assets is taxable in India at 30% plus applicable cess, with 1% TDS on transfers. Past performance is not indicative of future results. Do your own research before trading.
Frequently Asked Questions
- Why did Fahad avoid chasing Bitcoin after the initial rally?
- Fahad avoided chasing BTC because the clean upside move had already happened before the stream, leaving poor risk for a late entry. We wanted price to build structure, form a range, and rebuild liquidity before treating another move as tradeable. The marked levels at **81,749** and **82,000 to 85,000** were decision areas, not invitations to FOMO.
- What does seller exhaustion mean in Bitcoin order flow?
- Seller exhaustion means aggressive sellers kept hitting the market but lost the ability to push price lower. On the stream, Fahad read the BTC rally through that lens rather than blaming crude-oil expiry. Exhaustion differs from confirmed absorption because it still needs context from delta, open interest, CVD, liquidity, long-short ratios, and price behaviour.
- Why was 80,400 important for Bitcoin during the stream?
- The **80,400** level mattered because Fahad used a 15-minute close below it as evidence that sellers were regaining control. It gave us a concrete condition for changing the short-term read instead of relying on hope after a rally. Above that level, BTC still needed stronger confirmation before any bullish conclusion.
- What would a reclaim of the 82,000 to 85,000 zone mean for Bitcoin?
- A sustained daily or weekly reclaim of **82,000 to 85,000** would support Fahad's bullish path toward **$98,000**. A quick wick above the band would not qualify because price needed acceptance and closes above the area. Rejection and distribution below that zone kept the deeper **$57,000 to $59,000** scenario active in the stream's framework.
- How should traders use single prints without entering randomly?
- Traders should use single prints as areas to investigate, then wait for price interaction, structure, liquidity, and order-flow confirmation before acting. Fahad expected the single-print area below BTC could be tapped or filled, but he warned against random entries. A single print has value only when it fits a complete risk-defined setup.
Share this post

How to Use Direction Area Trigger in Nifty Trading
A Nifty short near 24,000 needed more than a pin bar: daily bias, a defined area and footprint evidence had to agree.

When to Quit a Profitable Intraday Strategy
Rs 12 lakh in profit looked different after Sidhant counted the 1,500 hours and the freedom the strategy had consumed.
How Bitcoin Open Interest Revealed Trapped Sellers
Bitcoin moved only about $100 near $78,000, but rising open interest revealed why a short could be premature.
Get post alerts in your inbox.
New blog post? We'll email you. No spam, unsubscribe anytime.
Join our Telegram community.
Get post alerts, trading discussions, and market updates.