Price Action Pullback Trading Strategy: The 1:2 Rule
The video turns a pullback into a trade plan: find at least two aligned levels, wait for confirmation, and target 1:2.
7 min read

The entry in the video did not come when price touched a line. Sidhant waited for a pullback into a zone backed by two or more aligned levels, then looked for a confirming candle. That is the price action pullback trading strategy we took from his walkthrough. We found the wait more useful than the finished-chart example: identify a clean trend, measure the relevant swing, and decide where an entry and stop would go. A correct directional read could still end in a stop-out if the entry was rushed. For beginners, Sidhant kept the exit rule at 1:2.
Key Takeaways
- If the swings could not be read cleanly, we had no useful pullback to measure.
- Confluence narrowed the area worth examining; it did not replace the entry trigger.
- The directional read told us which side to examine; the return to the zone determined whether there was an entry to assess.
- A stated trigger, candle-based stop and predetermined exit made the example testable instead of merely attractive on a finished chart.
- Passing on crowded price action was part of the plan, and sizing remained a separate decision.
Clean 5-minute and 15-minute trends come before pullback entries
We checked the swing sequence before treating a move as a pullback setup. On the 5-minute and 15-minute charts discussed in the video, higher highs with higher lows identified an uptrend; lower lows with lower highs identified a downtrend. Price moving between a high and low without clean swings was a range, so we left the setup alone.
Structure came before the candle pattern. Sidhant said, 'A ranging market is not an uptrend or a downtrend.' A few upward candles inside a sideways stretch did not make it a clean trend.
Market structure checks before looking for a pullback
| Chart condition | Swing pattern | Pullback decision |
|---|---|---|
| Clean uptrend | Higher highs and higher lows | Assess a pullback after marking a zone. |
| Clean downtrend | Lower lows and lower highs | Assess a return toward a marked zone. |
| Sideways range | Price moves between a high and low without clear swings | Skip the trend-pullback setup. |
The video used 5-minute examples and also recommended 15-minute charts. Sidhant discouraged 1-minute and 30-second charts for this method. 1-hour and 4-hour charts were not his intended intraday setup. A clean trend gave us something to measure, not an automatic trade. Our piece on choppy Bitcoin conditions also starts with the question of whether the swings are clear enough to read.
At least two aligned levels define a useful pullback zone
We built a zone of interest where levels lined up across the relevant swing, rather than trusting one support or resistance line. Sidhant used market structure, FRVP and Fibonacci. He wanted at least two aligned levels and personally preferred three. Price touching that zone still did not give us an entry without confirmation.
Mark the swing first. Sidhant identified the swing high or swing low that mattered to the example. He then applied FRVP from one end of that swing to the other and checked its volume-based levels, including the value area high or low.
Our checklist from the video was short:
- Structure: Mark the relevant swing high or swing low.
- FRVP: Measure that swing and note the volume-based levels.
- Fibonacci: Compare the 38%, 50% and golden-pocket areas with the other levels.
The Fibonacci retracement guide provides context for using retracement levels. In the video, those marks were useful when they clustered with structure and volume. We drew an area around the cluster because a single line suggested more precision than the chart offered.
Sidhant described the zone in terms of price action, volume and liquidity. For us, the test was whether the levels pointed to roughly the same place. Three levels were his preference, not a guarantee. Fahad's price-action insights offer related context on reading the chart before choosing an entry.
Breakdowns and bullish continuations both need a retest
We separated direction from entry timing in both examples. After an uptrend's previous higher low broke, Sidhant marked that swing low and considered a possible short only if price returned toward the confluence zone. For bullish continuation, he marked a swing high and waited for a pullback into aligned levels before assessing an entry.
The break was information, not the entry. In the short example, the old higher-low structure had changed. Chasing price away from the break would have skipped the zone Sidhant had built.
The sequence stayed the same on either side:
- Structure: Identify the swing and the possible continuation or reversal.
- Retest: Wait for price to return to the zone built with price action, FRVP and Fibonacci.
- Confirmation: Assess the reaction there rather than entering on contact.
In the bullish example, the marked swing high anchored the work before the pullback. Sidhant said the method could cover trend continuation and reversal trading. He also acknowledged the difficulty of explaining a retest on a completed chart: the decision is less tidy while candles are forming. Our Bitcoin pullback and liquidity-sweep analysis covers a related retest idea, without making this video's examples into a specific Bitcoin trade.
A pin bar trigger and a fixed 1:2 target simplify execution
We treated the pullback zone as a place to seek confirmation, not an order to enter on contact. In the video's long example, a break above the pin bar high triggered entry, with the stop below that same candle. Sidhant told beginners to exit at a fixed 1:2 risk-to-reward target.
The candle supplied the timing. The zone identified an area; the pin bar example gave us a specific trigger and a place for the stop. Our guide to pin bar entry rules goes further into that candle.
Entry and exit rules described in the video
| Approach | Trigger or first exit | Stop or remainder |
|---|---|---|
| Long-entry example | Break above the pin bar high after the pullback | Stop below the same candle |
| Beginner exit | Close the position at 1:2 | No remainder to manage |
| Optional intermediate management | Book 50% to 60% at 1:2 | Trail the remainder or move the stop to breakeven |
A candle label alone could not settle the entry. Sidhant noted that one trader's pin bar might be another trader's doji or indecision candle. We would define the break instead of relying on the pattern name. The price-action trading guide gives broader context for reading candlesticks alongside structure.
The video mentioned 1:4, 1:5 and a rare 1:10 as possible larger outcomes, then told beginners not to chase them. Keeping the beginner exit at 1:2 removed a decision. Intermediate traders had the separate option in the table, which called for managing the remainder after taking partial profit. Our piece on executing trading exits covers that distinction.
Crowded swings and poor sizing can undo a sound setup
We passed on the pullback setup when swings crowded together, overlapped or ground along without clear space between moves. Small higher highs or lower lows did not fix unclear structure. Sidhant also separated a tidy 1:2 plan from position sizing, exposure discipline and risk management. The entry pattern could not handle those jobs for us.
Skip the setup when:
- Swings overlap and the supposed trend has no clear legs.
- Price grinds in small steps, despite making minor new highs or lows.
- The position size or borrowed exposure makes the candle-based stop hard to respect.
Sidhant's sharpest point concerned entry quality. He said a trader with the right directional analysis could still get stopped out or liquidated by a poor entry. Waiting for the retest mattered as much as reading the structure.
He also used an 80% win rate to make a hypothetical point about weak risk management. It was not a measured result for this method, so we would not use it to judge performance. Our discussion of quality versus quantity in a trading strategy fits the decision to leave a messy chart alone.
The strongest part of the video was the discipline before the pin bar. Sidhant rejected the range, measured a clean swing, built a zone from aligned levels and waited for price to return. Our team would keep that sequence in view while assessing an entry, because a completed chart makes the pullback look much easier than it felt as the candles formed. The trigger still needs to be clear, and the planned stop has to fit the trader's position size. 1:2 kept the beginner example simple; it did not make every chart worth trading. Join the Hitpoint community for live market coverage and real-time trade alerts.
Watch the full video: The Price Action Strategy Pro Traders Don't Want Beginners to Know on YouTube
Disclaimer: This article is for educational purposes only and is not investment advice. The price levels, setups and trades described are a review of market events that have already occurred, shared to illustrate a method of analysis rather than to recommend any trade. Trading With Sidhant LLP is not a SEBI-registered Investment Adviser or Research Analyst, and nothing here constitutes a recommendation to buy or sell any security. Investments in securities markets are subject to market risks; read all the related documents carefully before investing. Past performance is not indicative of future results. Please consult a SEBI-registered financial adviser before acting on any information in this article.
Frequently Asked Questions
- How can I tell a clean trend from a sideways range?
- We look for a clear swing sequence: higher highs and higher lows for an uptrend, or lower lows and lower highs for a downtrend. In the video, price moving between a high and a low without that structure counted as sideways action. Crowded, overlapping swings also failed the check, even if a few candles made small new highs.
- Which FRVP and Fibonacci levels belong in a pullback zone?
- We look for FRVP volume levels, such as the value area high or low, lining up with structure and Fibonacci areas around **38%**, **50%** or the golden pocket. Sidhant applied the tools across the relevant marked swing. He wanted at least **two aligned levels** and preferred **three**; a Fibonacci mark on its own was not enough.
- Can the same pullback method work for both reversals and trend continuation?
- Yes, Sidhant used the method for both by marking the relevant swing and waiting for price to return to a confluence zone. A break of the previous higher low led into a possible short example. A marked swing high anchored the bullish continuation example. Neither initial move was an entry by itself.
- When does a pin bar trigger an entry, and where does the stop loss go?
- In the video's long example, a break above the **pin bar high** after the pullback triggered entry, and the stop went below that same candle. Sidhant cautioned that another trader might call the candle a doji or an indecision candle. We would use the stated break and stop rather than depend on the pattern name.
- Why use a 1:2 target, and when should I skip the setup?
- The **1:2** target gave beginners a fixed exit instead of an open-ended decision. We would skip crowded, overlapping or grinding swings, and any position whose size or borrowed exposure made the planned stop hard to respect. Sidhant's **80% win-rate** remark was hypothetical, not a measured result for the strategy.
Share this post
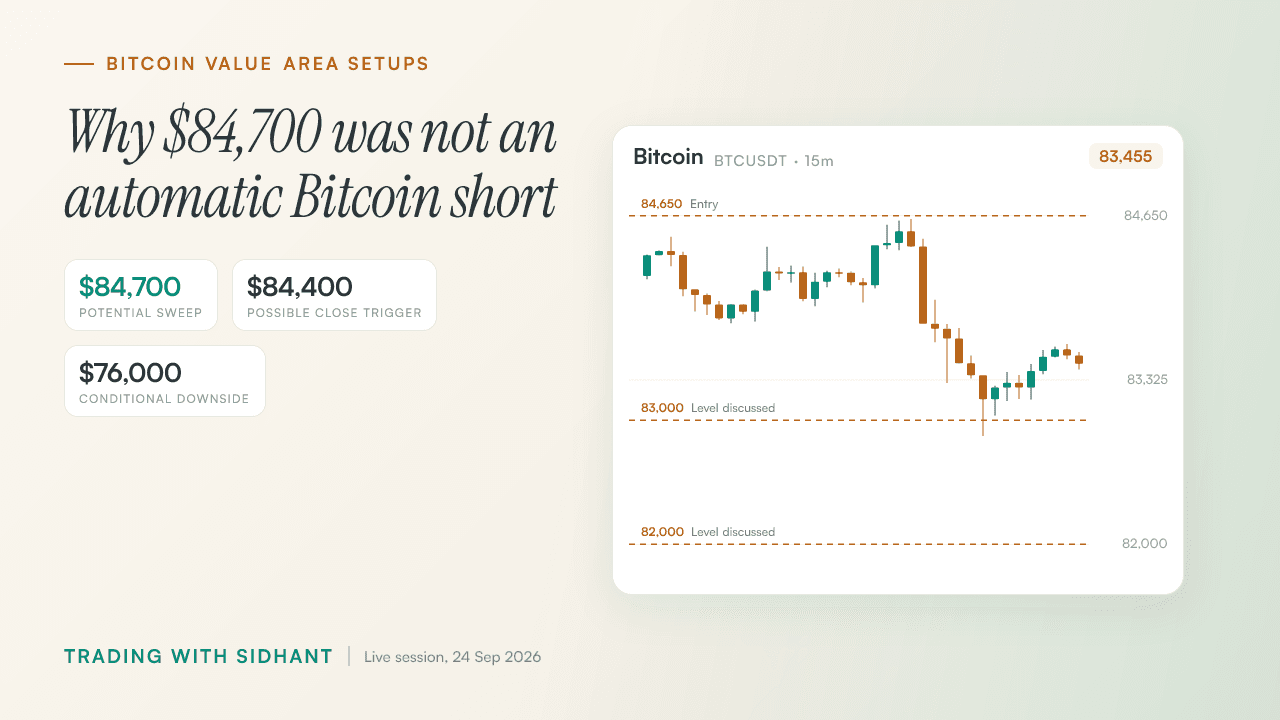
Bitcoin Value Area Trading Strategy: Wait for Confirmation
Bitcoin stayed above its prior value area, so Fahad treated $84,400 and $84,700 as conditional short setups, not automatic entries.
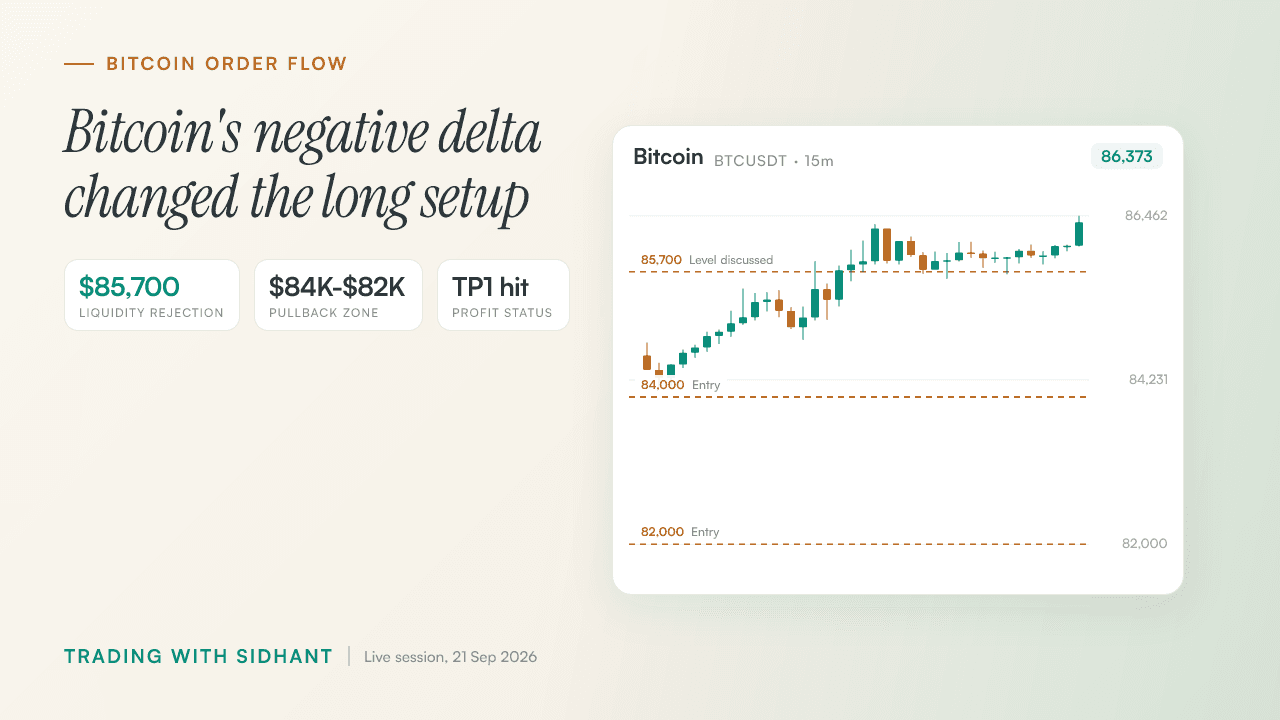
What Bitcoin Negative Delta and Rising OI Mean
Bitcoin rejected $85,700 liquidity, but negative delta and rising open interest kept the upside case alive.

Pin Bar Trading Strategy for Crypto: Entry Rules
A $700 result led into a three-step crypto setup built on direction, area and a pin-bar break.
Get post alerts in your inbox.
New blog post? We'll email you. No spam, unsubscribe anytime.
Join our Telegram community.
Get post alerts, trading discussions, and market updates.