What Bitcoin Negative Delta and Rising OI Mean
Bitcoin rejected $85,700 liquidity, but negative delta and rising open interest kept the upside case alive.
7 min read
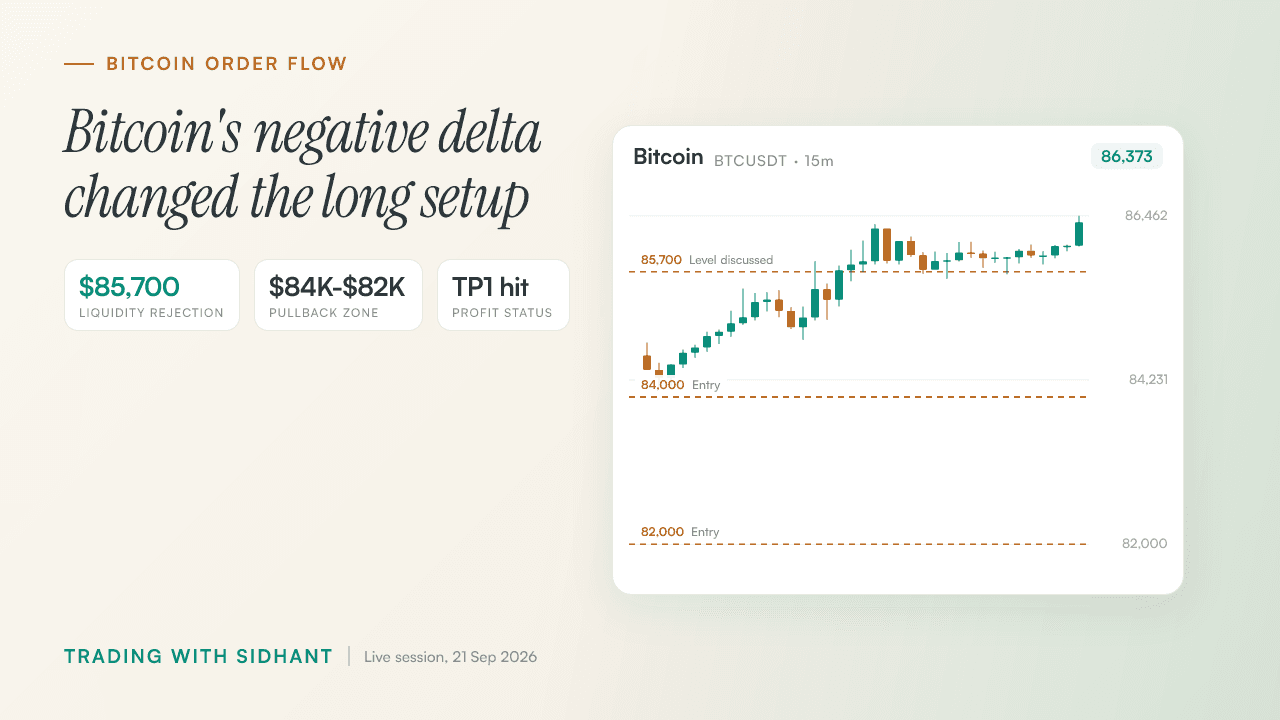
Bitcoin rejected $85,700, drawing attention toward $84,300-$84,000, before the footprint gave our team a different clue. That is what bitcoin negative delta and rising open interest mean when price sits near a major liquidity area: aggressive selling can build fuel rather than confirm weakness. Fahad saw negative delta while open interest climbed, and the reclaim became the level that mattered. 'This is going to be a massive move. This is going to be crazy,' he said as the long case returned to focus. Five publicly shared Bitcoin trades had already played out.
Key Takeaways
- A liquidity rejection set the downside map, but the later reclaim decision depended on order flow rather than candle direction alone.
- Negative delta became useful only after our team paired it with open interest, footprint size, and the price reclaim.
- The long idea had structure because entry location, failure point, and post-TP1 protection were defined before emotion took over.
- The gold short improved only after price proved that $4,334 had failed, rather than merely dipping below it.
- Protecting a winner at breakeven and replaying missed entries builds better habits than copying a call after it has moved.
Bitcoin rejected $85,700 before order flow revived the long case
Bitcoin pushed into the $85,700 liquidity cluster, rejected it, and initially pointed toward $84,300-$84,000. Fahad did not treat the rejection as an automatic short signal. Negative delta and rising open interest kept a separate upside case alive if price reclaimed the trapped area.
The downside map had structure. $85,600 had already been tapped, $85,700 was tested and rejected, and lower liquidity sat around $84,300-$84,000. Fahad said Bitcoin was not confirmed as bullish, but he was considering it a bullish-market candidate.
The rejection set a location, not a verdict. Price could continue lower, or it could flush weak positioning before reclaiming the area that triggered the selloff.
Bitcoin levels and the order-flow context behind each scenario
| Level or zone | What our team observed | Trading implication |
|---|---|---|
| $85,700 | Price reached a major liquidity cluster and rejected. | It created the initial case for lower prices. |
| $85,600 | This level had already been tapped. | Nearby liquidity had already been tested. |
| $84,300-$84,000 | This was the next lower area of interest. | We watched for reaction rather than chasing weakness. |
| $84,000-$82,000 | Fahad marked this as the larger pullback zone. | A hold there could support the planned long idea. |
Price was messy enough that levels mattered more than opinions. Our earlier breakdown of Bitcoin resistance and order flow explains why a level matters only after price reacts there.
A report from the same period described Bitcoin near $86,000, consistent with the high-liquidity environment around $85,700. Bitcoin ETFs Take Nearly $1 Billion as Price Nears $86,000.
◆ Interactive Lab
Open in new tab ↗Drive the order book yourself
Negative delta and rising open interest exposed trapped positioning
Negative delta showed aggressive selling, while rising open interest showed fresh positions entering during that pressure. In Bitcoin, that pairing made sellers vulnerable if price reclaimed the relevant area. Fahad used the footprint, rather than candle color alone, to manage the long thesis after the reclaim.
Negative delta needs price and open-interest context. Falling price with negative delta and rising open interest can show fresh shorts pressing the move. If price absorbs that selling and reclaims the area, those shorts can become forced buyers.
Recent Bitcoin candles showed aggressively negative delta while open interest rose. The footprint also showed roughly 1 million buyers near resistance, against ordinary volume readings such as 27,000, 300,000, and 400,000.
How the Bitcoin order-flow signals were read together
| Signal | Observation | Why it mattered |
|---|---|---|
| Negative delta | Recent candles showed aggressive selling. | We tested that selling against price response. |
| Rising open interest | New positions entered while delta stayed negative. | Crowded positioning became more likely. |
| 1 million buyers | Heavy buyer activity appeared near resistance. | The reading was far above ordinary volume examples. |
| Reclaim of the negative-delta area | Recovery was the trigger Fahad watched. | It could pressure trapped positions and support continuation. |
Fahad put it plainly: 'The data is so damn logical. It is so obvious.' Software is the screen, while exchange data supplies the traded flow. Without that data, a footprint is only a dressed-up volume display.
For a deeper example, see how Bitcoin open interest revealed trapped sellers. Coverage from the same market period also described Bitcoin giving back Monday's gain, showing why price direction alone did not answer the positioning question. Bitcoin gives back Monday's gain.
The $84,000-$82,000 pullback was the planned Bitcoin long zone
The larger Bitcoin long idea required a pullback into $84,000-$82,000, not an entry after a strong push. Fahad placed invalidation below that region and described the upside as new highs and higher levels. After TP1 hit on the position, our team reduced the remaining risk to breakeven.
Location separated the plan from a chase. A bullish-looking move can still offer poor entry conditions when price is extended, while the zone gave the trade a defined failure point.
- Entry zone: $84,000-$82,000 after a pullback and hold.
- Invalidation: Below the pullback zone.
- Target logic: New highs and higher levels.
- Management: TP1 hit, then the remaining Bitcoin stop moved to breakeven.
Fahad's excitement came after the setup began working, not before. Our team has covered the same location-first process in this guide to a Bitcoin pullback and liquidity sweep strategy.
Gold needed acceptance below $4,334 before the short improved
Gold had reversed and was dumping on the 15-minute chart, but our team wanted acceptance below $4,334 or a rejected pullback before the short improved. Fahad marked $4,329-$4,325 as the next downside area for an existing short, with risk above current highs.
Selling the lowest candle after a sharp dump is an expensive habit. Fahad waited for price action to show that the bracket-zone level had failed.
- Chasing the dump: Selling the sharp reversal without proof that $4,334 had failed.
- Better confirmation: A break and acceptance below $4,334, or a rejected pullback from the marked area.
- Downside area: $4,329-$4,325 for the existing short discussion.
- Risk framework: Stop above the current highs.
The chart below shows the levels discussed on the stream. Fahad said, 'If we lose $4,334, that is awesome. If we can start to push below this area, the trade will give a very good move.'
That patience applies beyond gold. Our team also wrote about confirmation in trading, because a level is not broken just because price pokes through it once.
For more gold-specific context, our review of XAUUSD liquidity around daily highs and lows explains why the reaction after a level matters more than the first touch.
◆ Interactive Lab
Open in new tab ↗Drive the order book yourself
Breakeven protection and replay work mattered more than copied calls
A shared trade idea never replaces an independent entry process. Our team stressed partial profit after TP1, moving the remaining Bitcoin stop to breakeven, and reviewing missed moves for better execution. Fahad warned viewers not to enter blindly because a setup appeared on the stream.
'Just because I am giving you that trade does not necessarily mean you should close your eyes and enter it.' That was the useful line from the day.
A missed trade is material for replay, not a failure. Review whether confirmation arrived too late, whether execution could have been refined on a smaller chart, and whether the original plan had a real invalidation.
- Profit protection: Bitcoin TP1 had hit, and the remaining stop moved to breakeven.
- Partial examples: Fahad discussed taking around 50%-70%, based on weekly performance and risk conditions.
- Execution ladder: Build context on 15-minute, refine on five-minute, then use one-minute when it adds precision.
- Weak consolidation: Avoid trading both directions because price is moving slightly.
Fahad also said, 'I am not selling you a dream here. The reality is that, yes, it fails as well.' A setup can fail, and that is why entry, protection, and review matter.
The strongest moment from this stream was not the claim that five Bitcoin trades had played out. It was the point where the $85,700 rejection looked bearish, yet our team stayed open to the footprint evidence instead of locking into the first read. Negative delta, rising open interest, and a reclaim gave the long case its logic. Then TP1 hit and risk moved to breakeven. That is the process we want to repeat: define levels, wait for confirmation, and manage risk once price moves. Join the Hitpoint community for live market coverage and real-time trade alerts.
Watch the full stream: What Bitcoin Negative Delta and Rising OI Mean on YouTube
Disclaimer: This article is for educational purposes only and is not investment advice. Crypto assets are unregulated in India, are highly volatile, and can lose value rapidly; there is no established investor-protection or grievance-redressal mechanism for them. Trading With Sidhant LLP is not a SEBI-registered Investment Adviser or Research Analyst, and nothing here constitutes a recommendation to buy or sell any asset. Income from virtual digital assets is taxable in India at 30% plus applicable cess, with 1% TDS on transfers. Past performance is not indicative of future results. Do your own research before trading.
Frequently Asked Questions
- What does negative delta with rising open interest mean in Bitcoin?
- Negative delta with rising open interest means aggressive selling occurred while new positions entered the Bitcoin market. It can reflect fresh shorts pressing price lower, but it can also expose trapped sellers if price absorbs the selling and reclaims the area. Our team reads it with footprint size, nearby liquidity, and price response rather than as a standalone directional signal.
- Why did Bitcoin reject the $85,700 liquidity area?
- Bitcoin rejected the $85,700 area after pushing into a visible liquidity cluster, while $85,600 had already been tapped. That rejection first pointed our team toward the lower $84,300-$84,000 area. Fahad did not treat it as proof of a larger bearish move because the footprint later showed negative delta alongside rising open interest.
- How can traders use a Bitcoin liquidation heat map?
- Traders can use a Bitcoin liquidation heat map to locate concentrated liquidity and watch price behavior when it reaches those areas. On the stream, darker yellow areas represented more liquidity, while lighter areas represented less. Our team used the map top-down, from $85,700 liquidity to the $84,300-$84,000 lower-interest area, before checking execution data.
- Why was the Bitcoin stop moved to breakeven after TP1?
- The Bitcoin stop moved to breakeven after TP1 because partial profit had been taken and the remaining position no longer needed full original risk. That protected the trade if price reversed after the first target. Fahad used it as trade management, not as a claim that the next move was guaranteed, so the remaining position did not carry the original loss risk.
- What confirmation was needed before shorting gold below $4,334?
- Gold needed a clean break and acceptance below $4,334, or a pullback into the marked area that rejected, before the short improved. The 15-minute chart had already dumped after a reversal, so chasing the first move offered poor execution. Fahad identified $4,329-$4,325 as the next downside area for an existing short, with risk above current highs.
Share this post

Pin Bar Trading Strategy for Crypto: Entry Rules
A $700 result led into a three-step crypto setup built on direction, area and a pin-bar break.

How to Use Direction Area Trigger in Nifty Trading
A Nifty short near 24,000 needed more than a pin bar: daily bias, a defined area and footprint evidence had to agree.
Bitcoin Order Flow Analysis After a Rally
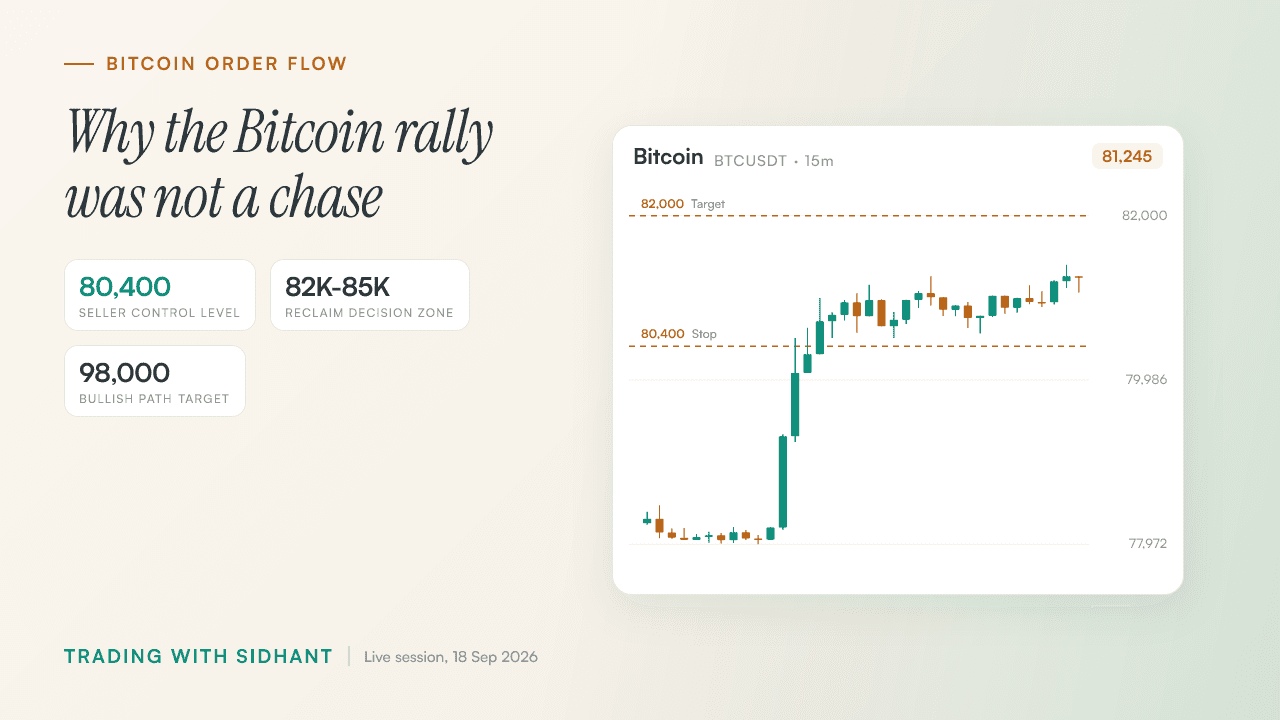
Bitcoin had already rallied, so Fahad used 80,400, delta and seller exhaustion to explain why waiting beat a FOMO entry.
Get post alerts in your inbox.
New blog post? We'll email you. No spam, unsubscribe anytime.
Join our Telegram community.
Get post alerts, trading discussions, and market updates.