How Bitcoin Open Interest Revealed Trapped Sellers
Bitcoin moved only about $100 near $78,000, but rising open interest revealed why a short could be premature.
7 min read
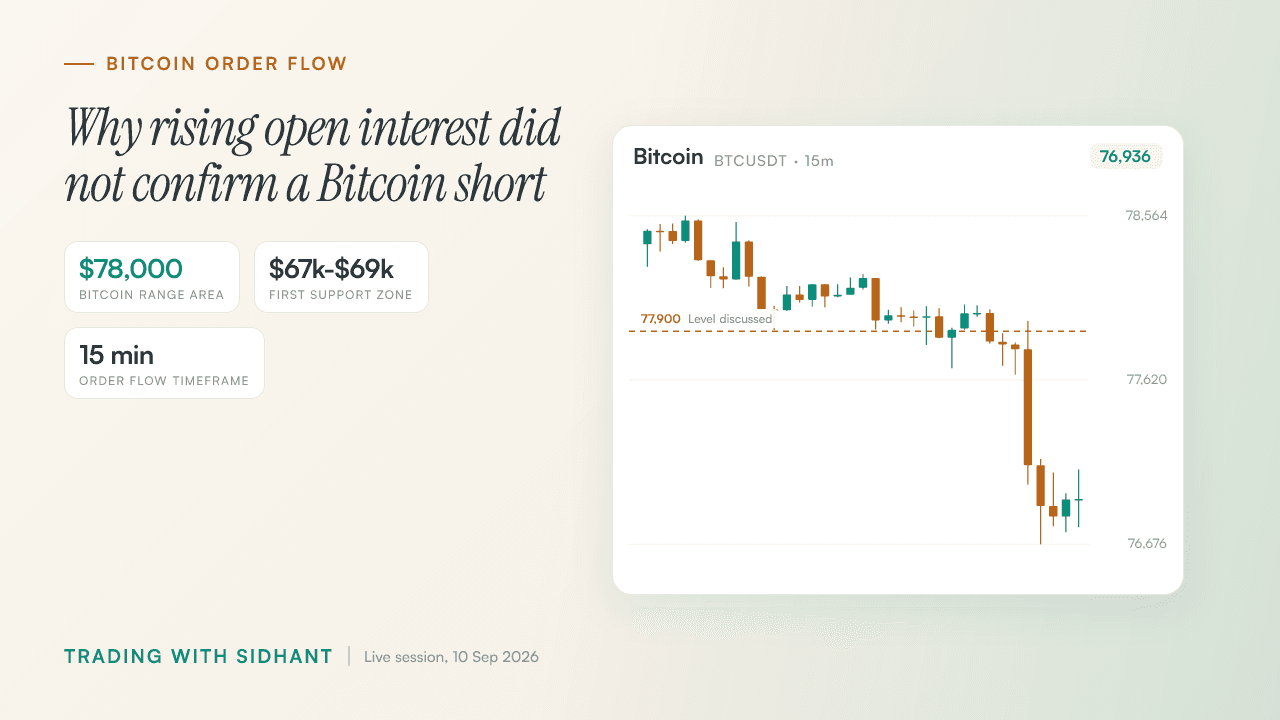
Bitcoin held around $77,900 to $78,000 and gave us no reason to touch it. Price moved roughly $100 up and down while open interest climbed, which is why how to spot trapped sellers with Bitcoin open interest matters. Fahad saw the mismatch in real time: 'The price is going up and money is also entering the market. But the money that is entering, they are shorting.' We did not force a BTC short in dead price action. Gold gave us cleaner structure near 4,389. Bitcoin gave information, not an entry.
Key Takeaways
- A tight $100 Bitcoin range gave our team information, but not enough structure to justify an entry.
- Rising open interest mattered because price held firm despite apparent short pressure, exposing sellers who lacked control.
- Price zones matter only when price and order flow show a response there, not because a level exists on a chart.
- The gold shorts depended on the reaction after a 4,389 sweep, especially the one-minute confirmation, not on guessing the level early.
- Partial profit near 1:2 and break-even protection preserve capital better than oversized risk and fantasy reward targets.
Bitcoin stalled near $78,000, so our team refused to force a trade
Bitcoin traded in a tight $77,900 to $78,000 pocket, and swings of roughly $100 gave us no clean direction or reliable invalidation. Fahad rejected random entries because the range offered little reason to put capital at risk. He said, 'Bitcoin is currently sideways, so there is no need to touch it.'
The plan was to ignore Bitcoin. Sitting out is part of the job when every move remains inside the same narrow area.
Range conditions that kept us flat:
- Price: repeated movement around $77,900 to $78,000
- Momentum: only about $100 up and down
- Structure: no confirmed bearish close or continuation
- Risk: entries inside the range had weak invalidation
Fahad had already made the call: 'The plan is to ignore Bitcoin.' We would rather miss a small move than trade chop for the sake of activity. That same patience sits behind our Bitcoin choppy-market approach.
Rising open interest and weak CVD pointed to trapped Bitcoin sellers
Bitcoin held near $78,000 as open interest increased, while upside CVD was relatively less aggressive on the 15-minute view. We read that split as new short participation that was not pushing price lower. A fresh short carried more risk than waiting for confirmation.
What the data suggested: sellers were adding exposure, but price was holding firm. Fahad put it plainly: 'The price is going up and money is also entering the market. But the money that is entering, they are shorting.'
How the Bitcoin order-flow signals changed the trade decision
| Signal | What our team observed | Trading implication |
|---|---|---|
| Price | BTC held near $77,900 to $78,000 | Sellers failed to create a clean breakdown |
| Open interest | Open interest increased | New positions entered the market |
| CVD | Upside CVD was relatively weak | Aggressive buying did not explain the full price hold |
| Combined read | New shorts appeared while price held firm | Fresh shorts risked joining trapped sellers |
Open interest alone does not settle the question. Rising OI can reflect new longs or shorts, so CVD and price response had to be read together.
We kept the bearish idea separate from the decision to enter. Our footprint trading guide follows the same check: see who is pressing, then see whether price follows.
Fahad's point was practical: 'You don't have to beat them. You have to be in their team. Get on the winning team. Winning will be easier.' When sellers press and price will not fall, we do not want to sell with them.
The $67,000-$69,000 zone mattered more than a rushed Bitcoin short
We marked $67,000 to $69,000 as the first Bitcoin area of interest below the range, followed by $58,000 to $59,000 and $45,000 to $47,000. Fahad also found a TPO single print near $74,000, while the immediate $78,000 area had no strong single-print reference.
A level gives us an area to watch, not an automatic entry. Fahad said, 'Footprint is not about predicting the future. It's breaking down and telling you what's happening in real life.'
Bitcoin levels our team tracked after the $78,000 range
| Zone | Why it mattered | What to wait for |
|---|---|---|
| $74,000 | TPO single print identified by our team | Price response and order-flow confirmation |
| $67,000 to $69,000 | First larger area of interest below the range | Liquidity reaction, volume, and structure |
| $58,000 to $59,000 | Deeper downside zone discussed on stream | Evidence of seller exhaustion or continuation |
| $45,000 to $47,000 | Broader lower zone | A clear market reaction, not blind buying |
| $45,000 to $50,000 | Wider major area on the larger view | Confirmation across price and order flow |
The chart marks $77,900, $78,000, and $74,000 from the stream. Price was still well above the cleaner TPO reference, yet traders were trying to create a trade in the middle of the range.
For us, $67,000 to $69,000 was a map reference rather than an automatic short target. Our Bitcoin pullback and liquidity-sweep framework explains the difference between a liquidity area and an entry trigger.
◆ Interactive Lab
Open in new tab ↗Drive the order book yourself
Gold shorts required a 4,389 liquidity sweep and one-minute confirmation
Gold offered a potential short near the 4,389 liquidity area only after a sweep and a confirming one-minute close. We considered an early entry unsafe because another push could invalidate it. Confirmation let us define risk above the prior swing high.
Fahad used the 30-minute and 5-minute charts to mark the range, then the one-minute chart for execution. Gold was in a messy area that could pump or dump, so patience mattered.
Gold short checklist around the 4,389 liquidity level
| Setup component | Confirmation requirement | Risk reference |
|---|---|---|
| 4,389 liquidity | A sweep into the level | No entry before the sweep |
| Volume response | Clear participation after the sweep | Avoid weak reaction candles |
| One-minute structure | A good one-minute close | Second short required this close |
| Entry management | Two shorts were taken on stream | Stop above prior swing high |
| Exit structure | Nearby range low | Roughly 1:2 risk-to-reward reference |
'Front-running is never a good thing,' Fahad said. The marked level alone was not enough. We needed the reaction after the sweep.
The chart marks 4,389, 4,200, and 4,500 discussed on stream. We treated 4,200 as broader downside context, not a promise. Our XAU/USD daily high and low liquidity strategy covers the same liquidity logic. A published Solana setup also described a liquidity sweep before the trade developed in this liquidity-sweep trade example.
◆ Interactive Lab
Open in new tab ↗Drive the order book yourself
A 1:2 trade with disciplined risk beats chasing extreme targets
We treated roughly 1:2 risk-to-reward as a practical benchmark for developing traders, particularly when partial profit could be taken and the remainder protected at break-even. Fahad rejected risking 20% of capital or chasing 1:50 targets. One trade should not define a trading career.
After roughly 1:2, protect the work. Fahad's process was to take partial profit, then move the remaining position toward break-even. That keeps a well-managed trade from turning into an unnecessary loss.
The numbers Fahad pushed back on were simple:
- 20% account risk on one trade
- Ratios like 1:30, 1:50, 1:60, and 1:100
- Treating a one-minute setup like a life-changing bet
- Judging skill from one day, one week, or one month
He said, 'One day changes nothing. One week changes nothing. One month changes nothing.' The horizon discussed on stream was 10 to 15 years. That is the time frame we use when survival matters.
This process-based trading post also focuses on disciplined targets and process. For exit mechanics, we have covered partial exits and trade management.
Our strongest decision on the stream was leaving BTC alone near $78,000. Open interest was rising, upside CVD was relatively weak, and price still would not break down cleanly. That made a short less attractive because sellers could be the trapped side. Gold deserved more attention because 4,389 gave us a defined liquidity event, followed by a one-minute confirmation for the second short. The lesson was simple: a quiet market does not need our participation, and a marked level still needs a reaction before it becomes a trade.
Join the Hitpoint community for live market coverage and real-time trade alerts.
Watch the full stream: How Bitcoin Open Interest Revealed Trapped Sellers on YouTube
Disclaimer: This article is for educational purposes only and is not investment advice. The price levels, setups and trades described are a review of market events that have already occurred, shared to illustrate a method of analysis rather than to recommend any trade. Trading With Sidhant LLP is not a SEBI-registered Investment Adviser or Research Analyst, and nothing here constitutes a recommendation to buy or sell any security. Investments in securities markets are subject to market risks; read all the related documents carefully before investing. Past performance is not indicative of future results. Please consult a SEBI-registered financial adviser before acting on any information in this article.
Frequently Asked Questions
- What does rising open interest with weak CVD mean for Bitcoin?
- Rising open interest with relatively weak upside CVD can show new positions entering while aggressive buying is not fully driving the move. On this stream, Bitcoin held firm near $78,000 as open interest increased, and Fahad read the combination as possible fresh shorts failing to push price lower. Price action still decides whether those sellers are trapped.
- How can traders identify trapped sellers using footprint data?
- Trapped sellers appear when sell-side aggression enters but price refuses to move lower or quickly reclaims the level. Footprint data lets traders compare executed volume, price response, CVD, and open interest in real time. We used that comparison on the 15-minute Bitcoin view rather than assuming a rising open-interest reading automatically confirmed a short.
- Why did Fahad avoid shorting Bitcoin near $78,000?
- Fahad avoided the Bitcoin short because price was stuck around $77,900 to $78,000, moving only about $100 at a time without clean confirmation. Open interest was rising while Bitcoin held firm, creating a risk that new sellers were getting trapped. He preferred waiting for a bearish close and structure rather than forcing an entry inside a choppy range.
- What were the key Bitcoin downside zones discussed by the team?
- The team discussed $67,000 to $69,000 as the first lower Bitcoin area of interest, with $58,000 to $59,000 and $45,000 to $47,000 as deeper zones. Fahad also identified a TPO single print near $74,000 and referred to $45,000 to $50,000 as a broader major area. These were response zones, not automatic targets.
- Why is front-running a liquidity sweep risky in gold trading?
- Front-running a liquidity sweep is risky because price can push beyond the marked level before reversing, leaving an early position exposed with poor structure. We waited for the 4,389 sweep, volume response, and a confirming one-minute close before treating the gold short as valid. That confirmation made the prior swing high a clearer risk reference.
Share this post

How to Use Direction Area Trigger in Nifty Trading
A Nifty short near 24,000 needed more than a pin bar: daily bias, a defined area and footprint evidence had to agree.
Bitcoin Order Flow Analysis After a Rally
Bitcoin had already rallied, so Fahad used 80,400, delta and seller exhaustion to explain why waiting beat a FOMO entry.
When to Quit a Profitable Intraday Strategy
Rs 12 lakh in profit looked different after Sidhant counted the 1,500 hours and the freedom the strategy had consumed.
Get post alerts in your inbox.
New blog post? We'll email you. No spam, unsubscribe anytime.
Join our Telegram community.
Get post alerts, trading discussions, and market updates.