How to Use Direction Area Trigger in Nifty Trading
A Nifty short near 24,000 needed more than a pin bar: daily bias, a defined area and footprint evidence had to agree.
7 min read

24,000 was the level everyone could see, and the five-minute pin bar was obvious too. What separated the Nifty example in the video was the proof underneath it: daily direction, a defined resistance area, negative delta, and sellers appearing in the footprint. That is how to use Direction Area Trigger in Nifty trading without turning every candle into a trade. I compared a world champion's process with the framework I have used for years. Different labels, same serious work. As I said in the video, 'Most of trading is actually not trading.'
Key Takeaways
- A trade required all three layers to agree, because a candle pattern without context was only a guess.
- A meaningful change in direction needed a break, retest and follow-through, not one dramatic candle.
- Open interest described positioning, but futures, structure and gamma context decided whether that positioning mattered.
- The 24,000 example depended on seller participation inside the candle, not on the pin bar pattern alone.
- Fixed timing, size and review rules protected decision-making long before a trade reached profit or loss.
Direction, Area and Trigger reduce a trade to three decisions
I use Direction, Area and Trigger to separate a market opinion from a setup that has earned risk. Direction comes from higher-timeframe structure, Area marks where price has reacted, and Trigger requires lower-timeframe proof. When one part is unclear, I skip the trade.
The filter matters more than another indicator. The champion's method in the video comparison was context, location and confirmation. That matched my framework closely.
I used:
- Daily chart: Direction
- One-hour chart: structure and meaningful Areas
- Five-minute chart: Trigger and execution evidence
'Trading has a language. There is some science to trading.' The daily chart can show broad pressure, but it cannot show whether buyers or sellers took control inside a five-minute candle. A pin bar on its own is only an opinion; at an Area, aligned with Direction and supported by footprint data, it becomes a structured example.
A real Nifty trend change needs a break, retest and N-shaped structure
I treated a Nifty directional change as credible only after price substantially broke a previous high or low, retested that break, and built an N-shaped structure. Smaller moves inside the broader range were lower-order structure, not enough to abandon the prevailing daily-chart environment.
From April onward, I reviewed roughly the previous four months of Nifty behaviour. The point was not to label every intraday bounce a reversal. That habit leaves traders fighting the larger structure.
'First you will see where the market is going, and then you will see which important areas exist along the way.' Direction came first, then Areas.
How the Direction, Area and Trigger timeframes worked together
| Framework step | Primary chart | Decision required |
|---|---|---|
| Direction | Daily chart | Identify the prevailing structure and any substantial break |
| Area | One-hour chart | Mark prior reactions, gaps, support or resistance zones |
| Trigger | Five-minute chart | Wait for participation evidence before taking risk |
A valid shift needed a substantial break, a retest, and an N-shaped structure after that retest. Movement in the middle of a larger range did not meet that standard. For more on refusing low-quality opportunities, I covered the same discipline in quality versus quantity in a trading strategy.
23,850 call open interest required an inverted institutional reading
I did not read large Nifty call open interest as an automatic directional signal because institutions often sell options rather than buy them. Positioning needed to be read with futures, gamma exposure and price structure, especially when the at-the-money strike sat near an important area.
In the video, Nifty futures were around 23,965 while the index was around 23,823.8. The at-the-money call sat near 23,850. Call open interest was approximately 2,717,456, against roughly 1,728,000 on the put side.
Nifty positioning figures discussed in the video
| Measure | Figure | How to interpret it |
|---|---|---|
| Nifty futures | 23,965 | Futures reference used beside index positioning |
| Nifty index | 23,823.8 | Spot reference in the example |
| At-the-money call | 23,850 | Strike nearest the discussed price area |
| Call open interest | 2,717,456 | Large call positioning, not a standalone signal |
| Put open interest | 1,728,000 | Lower than call positioning in the example |
| Gamma-related figure | 202,000 | Label was unclear in the video |
| Gamma-related figure | 141,000 | Label was unclear in the video |
The put-call ratio from those figures was about 0.64, but PCR needed context rather than a one-button conclusion. Zerodha's PCR and option positioning guide makes the same point: open interest is a data input, not a prediction machine.
'So turn your entire thesis upside down. That is what we have to worry about.' Heavy calls could reflect sellers capping rallies, which is very different from assuming call activity means bullish demand. Positive gamma was discussed as an environment where dealers tended to sell rallies and buy dips, while negative gamma could allow larger directional movement. For the mechanics behind reading participation before acting, see how confirmation works in trading.
The 24,000 short became valid only after footprint sellers appeared
I would not short Nifty merely because a five-minute pin bar formed near 24,000. The historical example earned attention only when daily direction, a resistance area, negative delta and aggressive footprint selling aligned, offering a path toward the previous swing with roughly 1:2 risk-reward.
The candle was visible. The order flow was the proof. A normal candle shows open, high, low and close. It does not show who was active inside it.
The volume profile in the video showed activity from 23,980 to 23,958, with the highest volume around 23,975. A low-volume pocket can allow faster travel because less activity slows price down.
Evidence required before acting on the 24,000 Nifty short example
| Evidence | Level or signal | Role in the setup |
|---|---|---|
| Resistance area | 24,000 | Psychological level where the rejection formed |
| Volume area | 23,980 to 23,958 | Zone used to judge prior participation |
| High-volume point | 23,975 | Most active price inside the profile area |
| Five-minute pin bar | Above 24,000 | Visual rejection, not sufficient alone |
| Delta | Negative | Selling pressure inside the candle |
| Footprint | Seller dominance | Confirmed aggressive selling activity |
| Prior swing path | 44 to 50 points | Historical example of available movement |
I changed the imbalance setting from 300 to 400 in the demonstration. Settings change what a footprint displays, so traders need to know what their tool measures.
The chart below shows the discussed 24,000, 23,965, 23,850, 23,823.8, 24,026 and 23,770 references on the hourly Nifty chart. The 23,770 level was an invalidation reference in the example.
A footprint trading order-flow guide goes deeper into why delta and imbalance provide more information than candle shape alone.
◆ Interactive Lab
Open in new tab ↗Drive the order book yourself
Position size and timing matter more than forcing a setup
I consider discipline incomplete when profit and loss can change a trader's next decision. A focused 9:15 to 11:00 window, adequate participation, a written journal and fixed risk limits can curb revenge trades, oversizing and the belief that every condition deserves an entry.
'If profit and loss affects you, you are not trading. You are gambling.' It is blunt because the damage from emotional sizing is blunt too.
The video used these participation and timing references:
- 9:15 to 11:00: preferred focused window
- 20,000 contracts: participation reference before considering activity
- Around 12:00: post-lunch volume could return
- Later: London-session activity could increase volume
- One to 1.5 hours: performance could begin deteriorating
Most traders lose discipline after a bad trade and try to recover immediately. Position size decides whether that spiral stays manageable or becomes destructive.
A journal can expose patterns memory hides. Performance may be clean for the first hour, then fade when boredom arrives. Written data has little patience for excuses.
I discussed knowing when to stop in when to quit a profitable intraday strategy. Keep the standard simple: do not overtrade, do not oversize, and do not move the psychological line after a trade is wrong.
The strongest part of the video was not the 24,000 rejection or the footprint screen. It was the reminder that professional traders often reach the same answer through repeatable work: establish Direction, mark the Area, then wait for a Trigger that shows participation. No magical Fibonacci number and no open-interest shortcut. I learned that lesson the expensive way after losing capital I once thought could buy a flat in Pune. Standards matter more after that. The work is quiet, but it is where trading decisions become cleaner.
Watch the next TWS video on YouTube. The process gets built there, unedited.
Watch the full video: World Champion Trader Uses MY Framework (Direction → Area → Trigger) on YouTube
Disclaimer: This article is for educational purposes only and is not investment advice. The price levels, setups and trades described are a review of market events that have already occurred, shared to illustrate a method of analysis rather than to recommend any trade. Trading With Sidhant LLP is not a SEBI-registered Investment Adviser or Research Analyst, and nothing here constitutes a recommendation to buy or sell any security. Investments in securities markets are subject to market risks; read all the related documents carefully before investing. Past performance is not indicative of future results. Please consult a SEBI-registered financial adviser before acting on any information in this article.
Frequently Asked Questions
- What is the Direction Area Trigger framework in Nifty trading?
- The Direction Area Trigger framework is a three-step way to assess a Nifty trade example. Direction came from higher-timeframe structure, Area marked a meaningful reaction zone, and Trigger required lower-timeframe confirmation. In the video, I used the daily chart for Direction, the one-hour chart for Areas, and the five-minute chart for footprint and delta evidence.
- How do I identify Nifty direction using market structure?
- Nifty direction was identified by reviewing daily-chart behaviour from April onward and separating major structure from smaller moves inside the range. A credible reversal required a substantial break of a prior high or low, a retest, and an N-shaped follow-through structure. A single sharp candle or minor intraday swing did not meet that standard.
- Why is heavy call open interest not always bearish or bullish?
- Heavy call open interest is not automatically bearish or bullish because large participants may be selling calls rather than buying them. The video compared approximately 2,717,456 call contracts with roughly 1,728,000 puts near the 23,850 at-the-money strike. Futures, price structure and gamma context were needed before reaching a view.
- How can footprint data confirm a Nifty pin bar setup?
- Footprint data can confirm a pin bar by showing buying and selling activity inside the candle, rather than only its open, high, low and close. In the 24,000 example, the five-minute pin bar had negative delta and seller dominance. The profile area from 23,980 to 23,958 added location context.
- What is the best time window for trading Nifty intraday?
- The video used 9:15 to 11:00 as the preferred focused Nifty trading window because participation was often stronger then. It also noted that activity could return around 12:00 and later with the London session. The larger lesson was to track personal performance, since focus could deteriorate after one to 1.5 hours.
Share this post
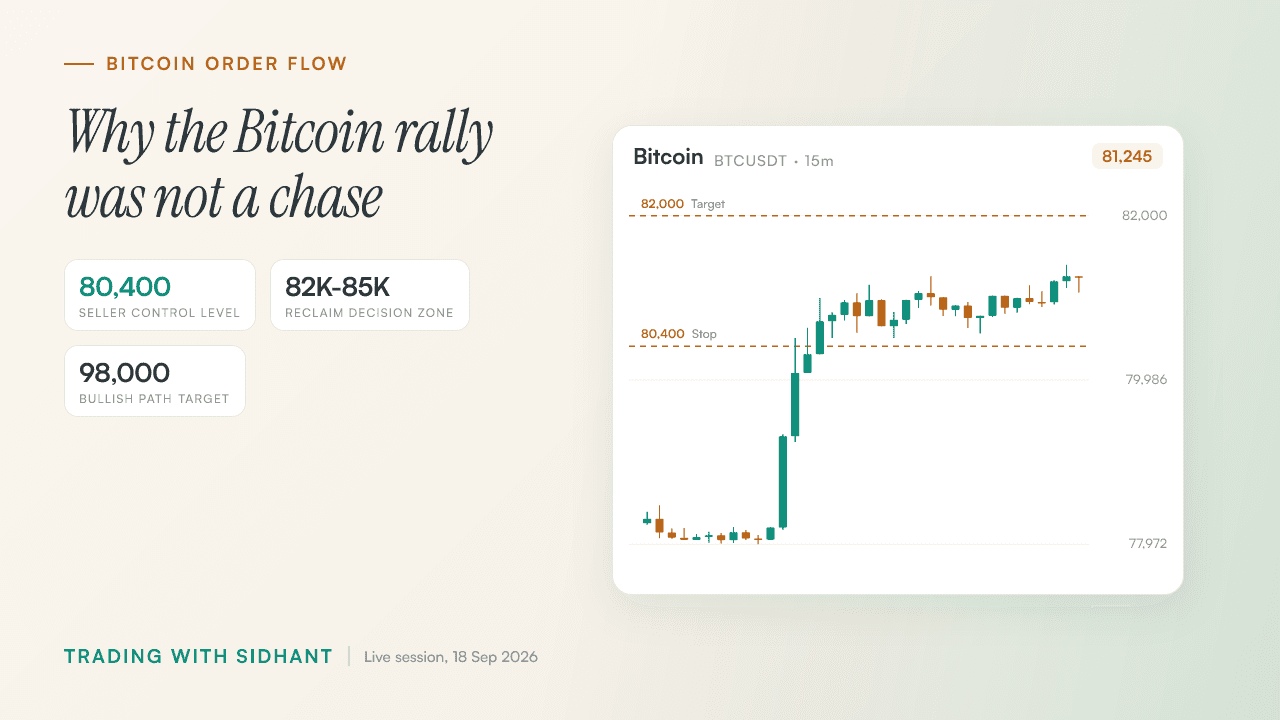
Bitcoin Order Flow Analysis After a Rally
Bitcoin had already rallied, so Fahad used 80,400, delta and seller exhaustion to explain why waiting beat a FOMO entry.

When to Quit a Profitable Intraday Strategy
Rs 12 lakh in profit looked different after Sidhant counted the 1,500 hours and the freedom the strategy had consumed.
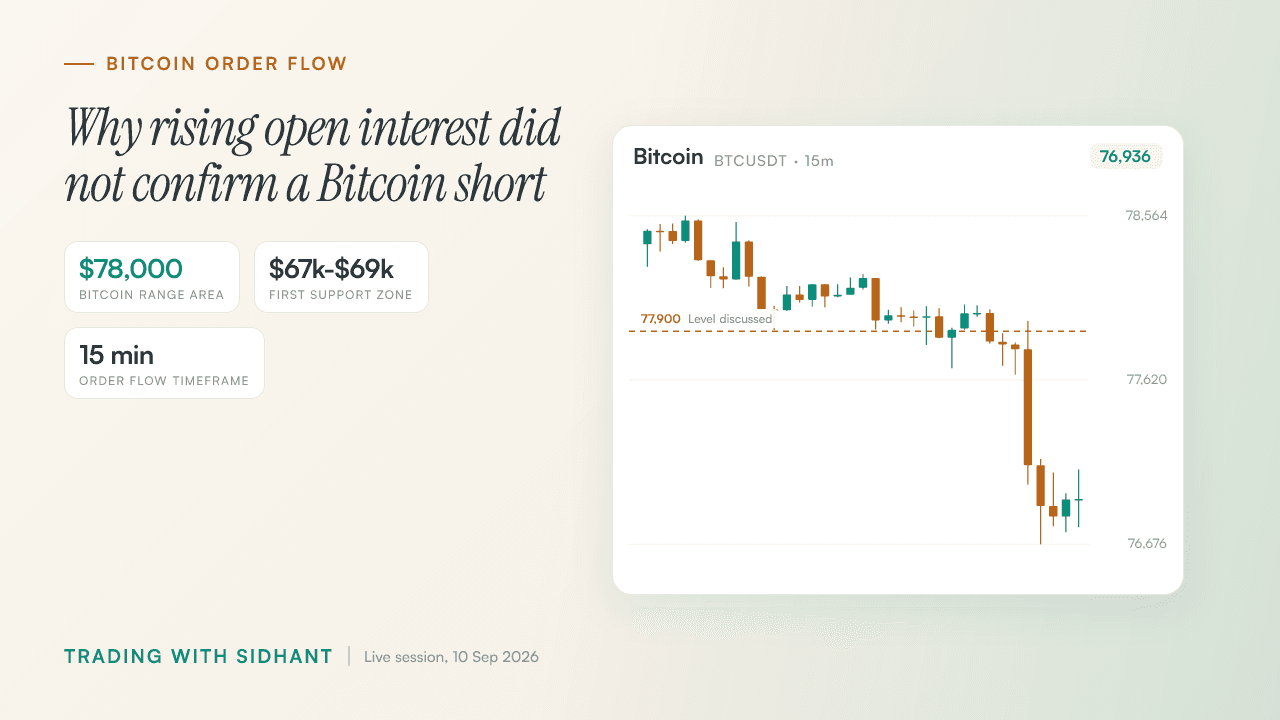
How Bitcoin Open Interest Revealed Trapped Sellers
Bitcoin moved only about $100 near $78,000, but rising open interest revealed why a short could be premature.
Get post alerts in your inbox.
New blog post? We'll email you. No spam, unsubscribe anytime.
Join our Telegram community.
Get post alerts, trading discussions, and market updates.