How to Read Bitcoin Open Interest and CVD Before 87,000
Rising CVD supported Fahad's Bitcoin upside bias, but a later drop in open interest changed what the buying meant.
8 min read
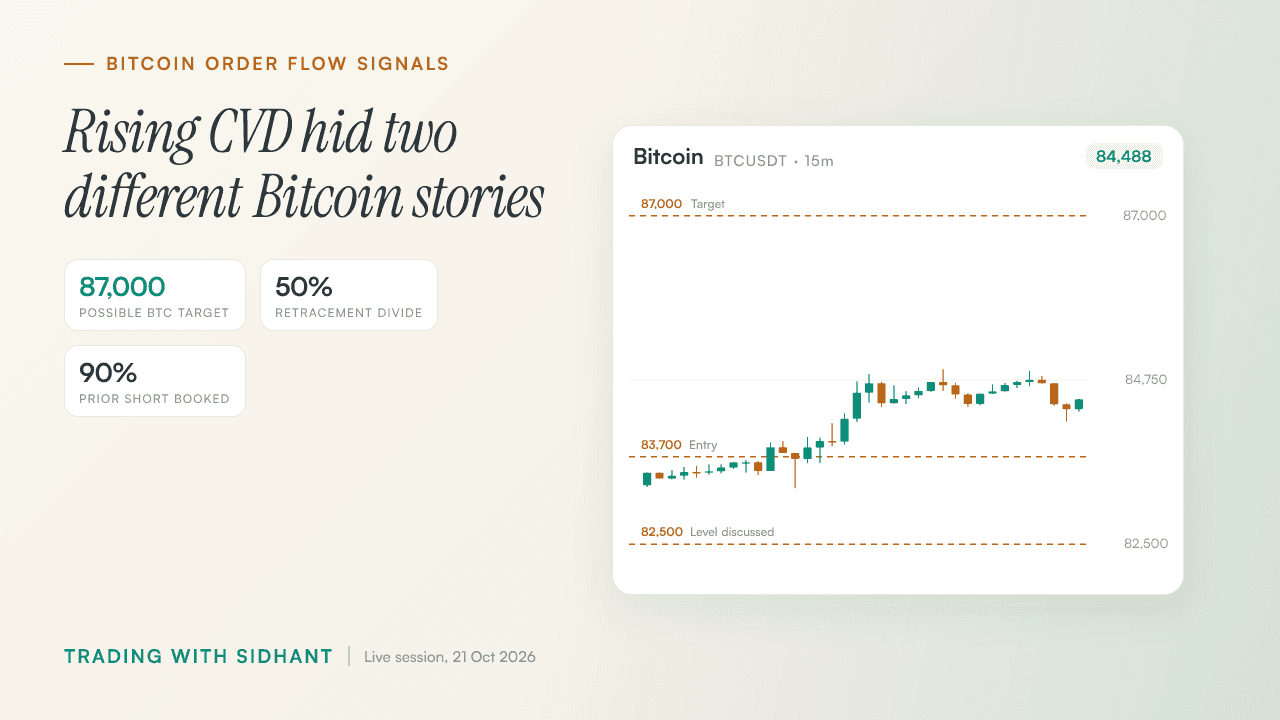
Bitcoin pushed into a watched reversal area, and Fahad still refused to short it. 'I don't have any reason right now based upon price action that I would want to short here,' he said on the stream. Earlier, rising open interest and CVD had supported his upside bias. Later, CVD kept climbing while open interest fell. The buying pressure looked similar, but the positions behind it told a different story. That shift is why how to read bitcoin open interest and cvd mattered more than the zone itself, even with 87,000 on Fahad's upside map.
Key Takeaways
- Rising CVD can accompany either more open positions or shorts closing. Open interest changes how Fahad read the buying.
- Negative delta shows aggressive selling. The price response shows whether that selling moved the market or was absorbed.
- The 50% level set up Fahad's conditional path toward 87,000. A touch of the golden pocket did not confirm a short.
- Fahad booked most of his earlier short after price moved below the candle, then passed on a later short that lacked a reversal.
- Fahad waited on gold and passed on HYPE and oil rather than forcing another trade after Bitcoin's move.
Rising CVD supported Bitcoin, but open interest changed the reading
Fahad initially leaned toward a Bitcoin move higher because open interest and cumulative volume delta, or CVD, were both rising. Later, CVD rose while open interest fell, which he read as shorts closing. Both readings showed buying pressure, but the change in outstanding positions made them different signals.
Bitcoin had pumped, dumped, then returned to a sideways range. Price was moving, but it was not offering much direction on its own. Fahad used the order-flow data to work out what might be driving the buying.
Open interest tracks outstanding derivative contracts. Fahad described a rise as money entering and a fall as money leaving. CVD tracks the running balance of aggressive buying and selling, as explained in CoinGlass's guide to price, OI and CVD.
Fahad's two Bitcoin order-flow readings
| CVD | Open interest | Reading |
|---|---|---|
| Rising | Rising | Aggressive buying alongside more open positions supported Fahad's initial upside bias. |
| Rising | Falling | Buying alongside fewer open positions suggested shorts were closing. |
A trader closing a short buys back what they sold. That can lift CVD while open interest falls because the position is disappearing. It is not the same participation Fahad saw when both measures rose. Our earlier Bitcoin short-covering breakdown covers the distinction.
Neither combination gave Fahad a trade by itself. After Bitcoin's sharp move back into a range, he still wanted price action to back up the order-flow read.
Negative delta in a green candle exposed trapped sellers
A green candle can carry negative footprint delta when aggressive selling exceeds aggressive buying inside it, even though price closes above its open. Fahad showed sellers pressing near the bottom while larger resting buy orders absorbed them. When price recovered, traders who sold the apparent breakdown were caught on the wrong side.
Candle colour describes the open-to-close move. Footprint delta shows which side was more aggressive during that move. In Fahad's example, the green close did not erase the selling recorded inside the candle.
- Footprint: Executed market orders showed sellers hitting bids.
- Order book: Resting limit buy orders showed where that selling met demand.
- Price response: A recovery showed the apparent breakdown had failed.
'But these sellers who were being aggressive, they got absorbed by all the bigger buy orders,' Fahad said. Those bids took the selling without allowing price to stay down. A large negative delta, then, did not require a red close.
Fahad also flagged rising CVD during a pullback as a possible clue to absorption. The clue needed a price response: selling into a level is one observation, while failing to push through it is another. The footprint delta guide on false signals expands on that distinction, and Gate's CVD explainer covers the indicator itself.
If a breakdown holds, sellers have moved price where they wanted it. If price reclaims the area despite aggressive selling, the traders who sold the break may have to get out.
Acceptance above the 50% level opened a path toward 87,000
Fahad treated Bitcoin's 50% retracement as the divide between discount and premium. A close and sustained acceptance above it could open a path toward 87,000. Reaching the nearby golden-pocket area, though, was not enough to justify a short. He wanted a reversal confirmed by price action, not assumed from a touched zone.
'I don't have any reason right now based upon price action that I would want to short here,' he said after Bitcoin pushed into the watched area. The zone had his attention. Price had not given him a reason to sell it.
For another long, Fahad preferred a pullback with a liquidity sweep over chasing Bitcoin higher. VWAP and Hit Point levels were areas where he could judge the response. His description of VWAP as a rubber band captured how far price can stretch from it, though a stretch does not tell you when price will come back.
- At the 50% retracement: Fahad watched whether price could close above the discount-to-premium divide.
- On acceptance: His upside scenario left room toward 87,000.
- On a pullback: VWAP and Hit Point levels gave him places to assess buying pressure.
Fahad also said liquidity does not have to be swept before every continuation. He could prefer the pullback without insisting that Bitcoin take one particular route. Our Bitcoin pullback and liquidity-sweep guide covers that approach.
The earlier Bitcoin short showed why partial exits matter
Fahad described an earlier Bitcoin short near a wick top, around 83,700 to 83,750. After price moved below the candle, he booked about 90% of the position. The remainder returned to break-even. A separate Telegram trade reached TP1, and he offered moving its stop to break-even as a cautious option.
The exit followed the move. 'I had shorted at its top and as soon as we went below this candle, I booked almost 90%,' Fahad told viewers. He took most of that short off when price responded, rather than waiting for another level to tell him the move had worked.
The chart marks 83,700 and 83,750 alongside the discussed 87,000 level. It also shows 82,500, a long entry reported by a viewer. That viewer's entry was separate from Fahad's earlier short.
When Bitcoin later reached the golden-pocket area, he did not repeat the short simply because price had arrived at a watched zone. He had acted on the earlier position after price moved below the candle. At the later zone, he could not see the reversal he wanted.
On the separate Telegram trade that reached TP1, Fahad said traders who wanted to play it safe could move their stop to break-even. The Bitcoin liquidity-sweep discussion of TP1 and stops goes further into that management choice.
◆ Interactive Lab
Open in new tab ↗Drive the order book yourself
Gold and HYPE offered no reason to force another trade
Fahad watched gold at 4,135 and 4,141 but waited for a candle close before choosing a direction. Later, gold and silver were choppy around VWAP. He passed on HYPE in both directions because he disliked its bottom structure. With Bitcoin's move already made, another trade needed a better chart than these offered.
'How this candle closes in the next 8 minutes will decide the direction for me,' he said while assessing a possible gold short. Both discussed gold levels appear on the chart below. The candle was still forming, so he waited rather than treating the level as the decision.
HYPE had a developing liquidity pattern, but its structure put Fahad off the long. He did not like the short either: 'So hype watch, nothing for me right now.'
- Gold and silver: Both later chopped around VWAP without a clear direction.
- HYPE: The bottom structure kept Fahad out on either side.
- Oil: He considered a short after a VWAP retracement, but the local structure offered no compelling place to act.
Fahad compared patience to fishing in a pond with plenty of fish. 'If you know that there are endless fish here, then why not have a safe approach? Why do you need to become a hero?' After Bitcoin's move, stepping away from dull charts suited that thinking. We covered similar restraint in when rising Bitcoin OI still led to zero trades.
◆ Interactive Lab
Open in new tab ↗Drive the order book yourself
Fahad had already shown that he could act on a Bitcoin short and manage the exit. The harder decision came later, when price reached a watched area and he had no price-action reason to short again. Open interest changed his reading of the buying, while the 50% retracement kept the upside scenario in view. Neither observation required an immediate trade. Gold, HYPE and oil offered little to improve the choice. Once Bitcoin had made its move, getting away from the screen was a reasonable call. Join the Hitpoint community for live market coverage and real-time trade discussions.
Watch the full stream: 🔴 BTC & Gold Live Trading | See Where Big Players Buy & Sell (Order Flow) on YouTube
Disclaimer: This article is for educational purposes only and is not investment advice. Crypto assets and virtual digital assets are unregulated in India, are highly volatile, and can lose value rapidly; there is no established regulatory recourse for losses from them. The price levels, setups and trades described are a review of market events that have already occurred, shared to illustrate a method of analysis rather than to recommend any trade. Trading With Sidhant LLP is not a SEBI-registered Investment Adviser or Research Analyst, and nothing here constitutes a recommendation to buy or sell any asset. Income from virtual digital assets is taxable in India at 30% plus applicable cess, with 1% TDS on transfers. Past performance is not indicative of future results. Do your own research before trading.
Frequently Asked Questions
- What does rising Bitcoin open interest alongside rising CVD suggest?
- It suggests aggressive buying alongside an increase in outstanding derivative positions. That combination supported Fahad's initial upside bias on the stream. Open interest alone does not identify which side will win, and CVD alone does not show whether positions are opening or closing. Fahad checked the readings against Bitcoin's price action rather than using them as an entry signal.
- Why can CVD rise while Bitcoin open interest falls?
- CVD can rise while open interest falls when buying closes existing short positions. Fahad gave that reading later in the stream, after initially seeing both measures rise. Closing shorts can still add buying pressure, but the drop in outstanding positions tells a different story from aggressive buying accompanied by rising open interest.
- How can a green Bitcoin candle have negative footprint delta?
- A green candle can have negative footprint delta when aggressive selling exceeds aggressive buying inside it, yet price closes above its open. Fahad showed sellers pressing near the bottom while larger resting buy orders absorbed them. Candle colour records the open-to-close move, while delta records aggressive trading within the candle. The recovery showed that the apparent breakdown had failed.
- What would make 87,000 a plausible Bitcoin continuation target?
- A close and sustained acceptance above the 50% retracement would make 87,000 plausible in Fahad's upside scenario. He treated that retracement as the divide between discount and premium, so a brief move above it was not enough. For another long, he preferred assessing a pullback and possible liquidity sweep over chasing price toward the level.
- Why did Fahad avoid shorting Bitcoin at the golden pocket?
- Fahad avoided the short because price action had not confirmed a reversal at the watched area. He said he had no reason to short based on what Bitcoin was doing, despite its move into the golden pocket. He left room for continuation instead of assuming the zone would hold, and waited for a clearer price response.
Share this post
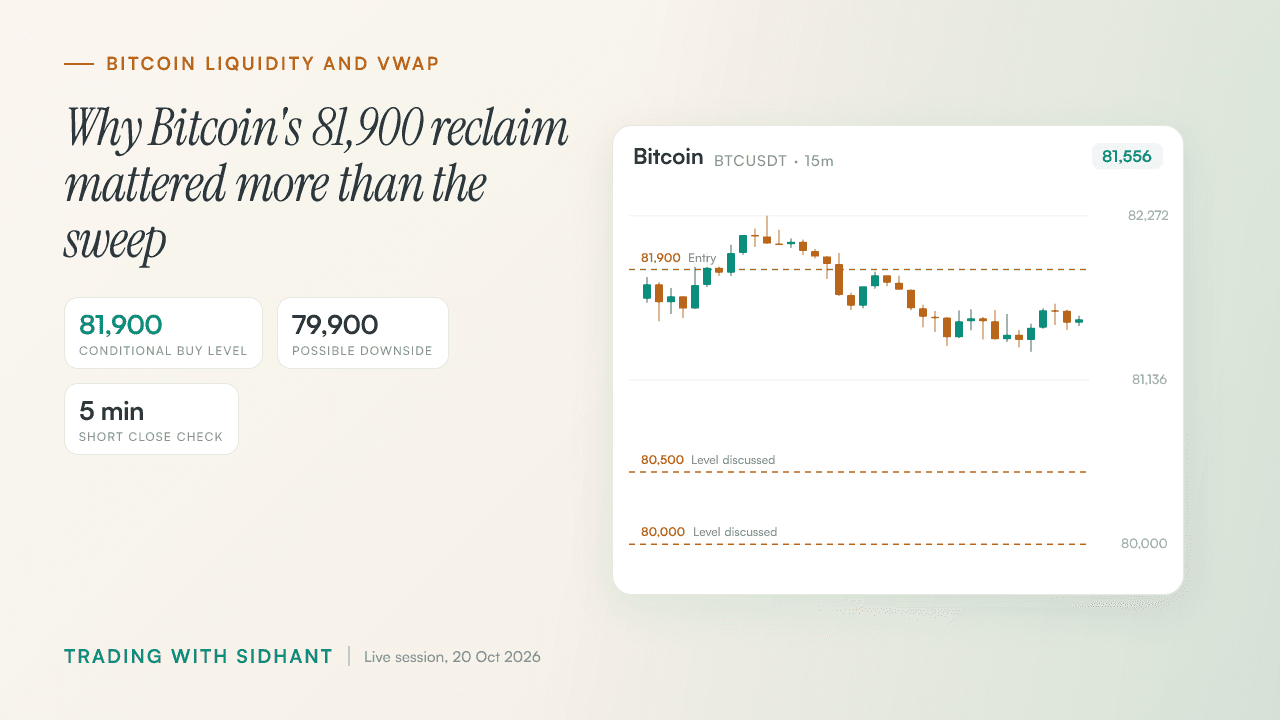
How to Trade Bitcoin Liquidity Sweeps Near 81,900
Bitcoin swept both sides of its range, but Fahad wanted an 81,900 reclaim to buy or a confirmed VWAP loss to short.
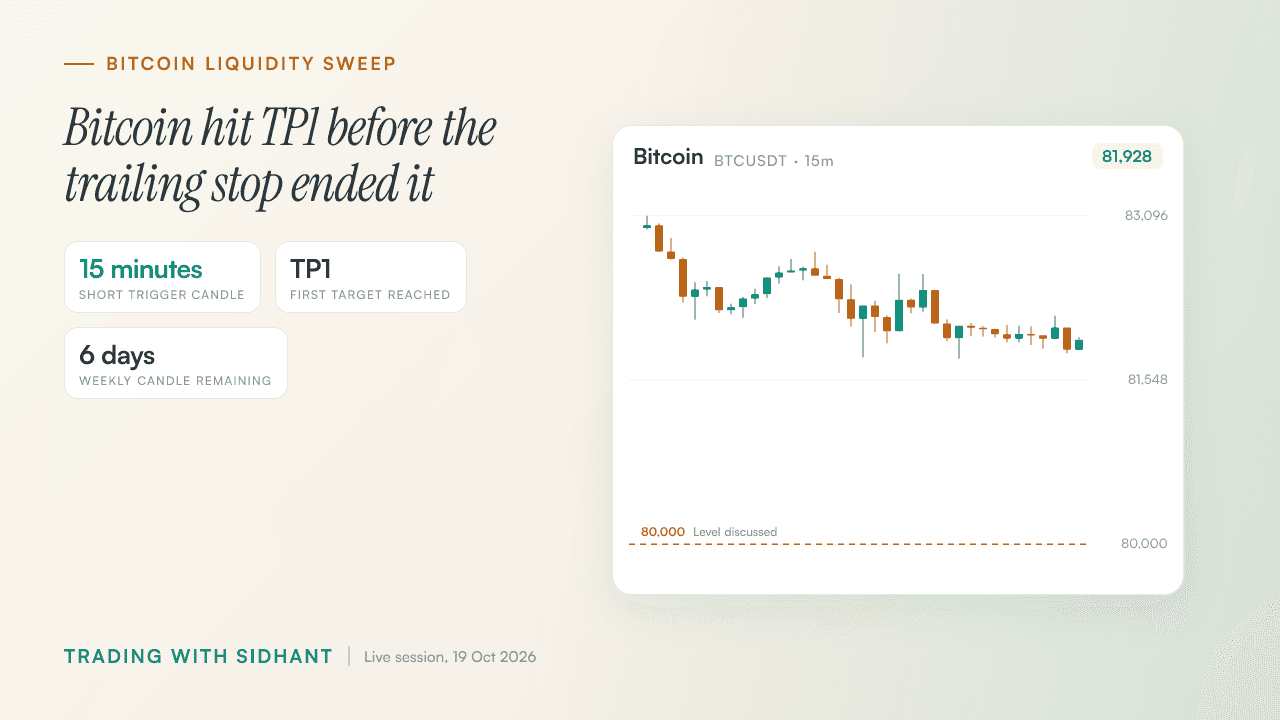
Bitcoin Liquidity Sweep Trading Strategy: TP1 and Stops
A Bitcoin short reached TP1, but the bigger lesson came from the trailing stop that ended the trade.
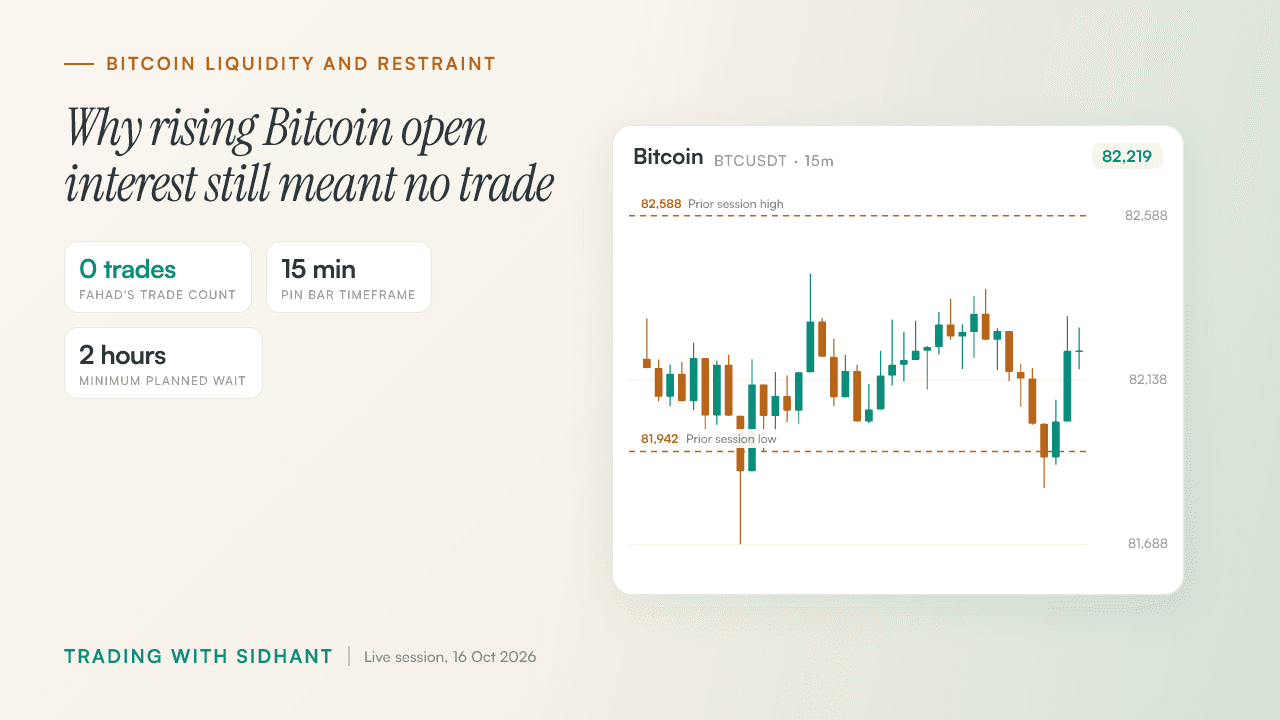
When Not to Trade Bitcoin: Rising OI, Zero Trades
Bitcoin open interest rose as CVD fell, but weak volume and conflicting signals kept Fahad out of the market.
Get post alerts in your inbox.
New blog post? We'll email you. No spam, unsubscribe anytime.
Join our Telegram community.
Get post alerts, trading discussions, and market updates.