Why Bitcoin Rises While Open Interest Falls
Bitcoin rose as open interest fell, but Fahad kept our team neutral inside a $600 range rather than forcing a short.
7 min read
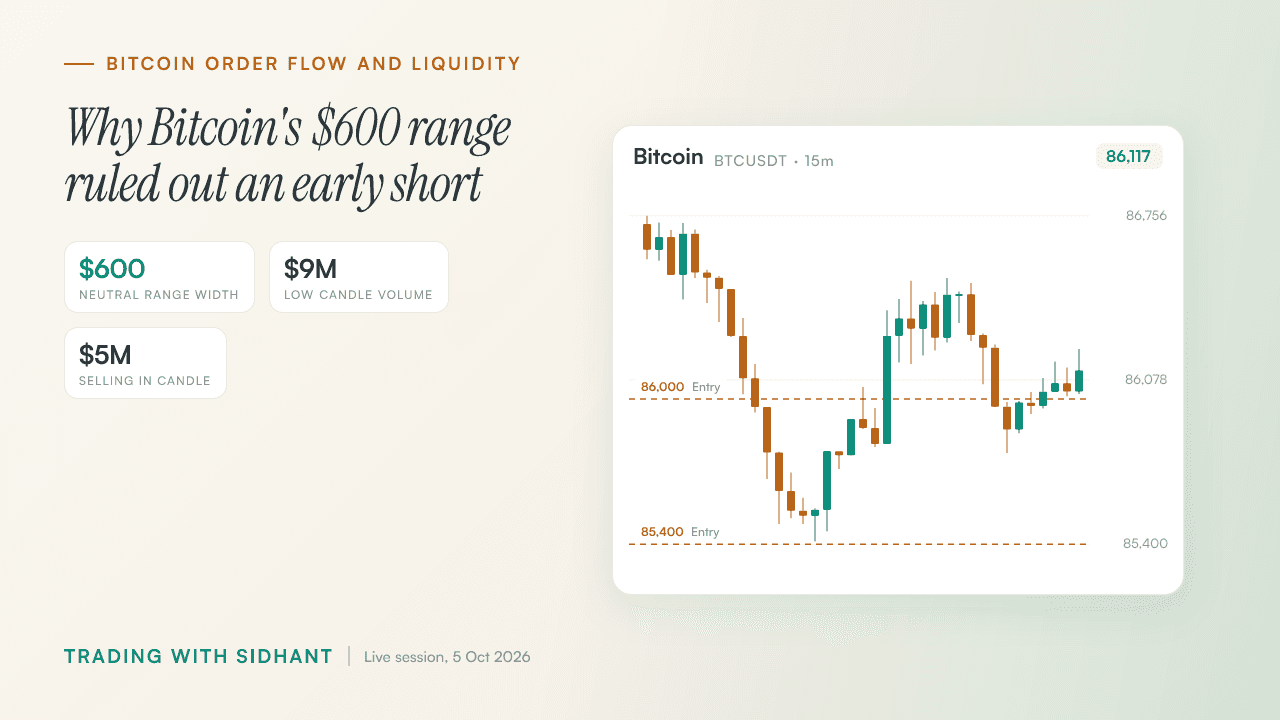
Bitcoin climbed while open interest fell, and Fahad refused to short it. On the stream, he kept our team neutral inside 85,400 to 86,000 despite a bearish read. If you have wondered why bitcoin rises while open interest falls, this was a useful case. Shorts were being reduced, CVD offered little support, and liquidity sat above a prior high. None of that gave us an entry. Later, a $9 million footprint candle showed how heavy selling could meet a bounce. Price still had to confirm what the order flow suggested.
Key Takeaways
- A directional opinion gave our team a plan, but the high-volume pause kept it from becoming an entry.
- Falling open interest explained our caution; only a confirmed price move could turn that caution into a trade.
- Negative delta identified aggressive sellers, while the close back above the range showed their selling had been absorbed.
- The same confirmation rule produced different responses across oil, gold and silver because their price action was different.
- Owning the HYPE stop-out left room to judge the next setup on its own evidence.
Bitcoin stayed neutral between 85,400 and 86,000
Fahad kept our team neutral while BTC traded between 85,400 and 86,000, a $600 range. He expected lower prices but wanted the marked weakness area lost and confirming closes below it before considering a short. A reclaim of the strength point would have put upside in focus instead.
A bearish read was not a short entry. Price was pausing at a high-volume node, and Fahad saw too little evidence to act immediately. We had boundaries to watch and a reason to wait between them.
Fahad's conditional Bitcoin bias
| Price condition | Bias | Required response |
|---|---|---|
| Within 85,400 to 86,000 | Neutral | Wait rather than force an entry |
| Marked weakness area lost | Bearish if confirmed | Look for closes below the area before considering a short |
| Marked strength point reclaimed | Upside in focus | Reassess the bearish read |
The chart below marks 85,400 and 86,000 on the session's BTC candles. It does not price Fahad's separate weakness and strength points. Our approach to a Bitcoin liquidity sweep with confirmation makes the same distinction: a level draws attention, but the response determines whether we act.
◆ Interactive Lab
Open in new tab ↗Drive the order book yourself
Falling open interest weakened Bitcoin's move higher
On the BTC one-hour chart, price rose while open interest fell and CVD stayed broadly sideways or drifted lower. Fahad also saw net longs lag the move as shorts were reduced. Our team read that as weak participation behind the rise, not proof that a short would work before price confirmed.
Higher price did not mean stronger positioning. Buying was happening because price was moving up, but the position data told a less convincing story. Fahad put his assessment bluntly: 'Neither this dump was sustainable nor is this fake pump sustainable.'
- Open interest: it declined as BTC pushed higher.
- CVD and net longs: CVD was flat to weaker, and net longs did not keep pace with price.
- Short positioning: shorts were being reduced during the rise.
That gave Fahad reason to consider short covering as part of the move. It did not tell us who every buyer was. We have covered Bitcoin open interest and CVD when price rises, but on this stream the price response still had the final say.
The liquidation heat map showed liquidity above a prior high, with no exact price given for that high. Fahad watched the area as a possible place to assess a short. Entering early would have ignored both the overhead liquidity and the intact neutral range.
A $9 million footprint candle showed sell absorption
A BTC five-minute candle swept below a range low and closed back above it despite about $5 million of selling within roughly $9 million of total volume. Fahad called the move sell absorption: market sell orders met resting limit buy orders. We could see the recovery, but it was not a standalone buy signal.
The close told us what the sellers achieved. Fahad pointed to the candle at the bottom: 'And yet the price pushed to the upside.' Sellers pressed the market, but they could not keep it below the swept level.
Before examining the footprint, Fahad switched from aggregated exchange data to Bybit-only BTC data. The displayed volume totals changed with that switch, so we kept the two views separate.
- Total volume: about $9 million traded in the low-sweep candle.
- Selling: about $5 million came from sellers, yet the candle recovered above the range level.
- Footprint rows: they showed total volume, delta and buyer-versus-seller imbalance at each price.
Delta records the difference between aggressive buying and selling. In Fahad's example, 100 buyers against 200 sellers gave a negative 100 delta, shown red. The red reading identified selling pressure, while the recovery showed resting orders had absorbed it. For a closer look, see our guide to footprint chart delta and false signals.
A large selling figure can catch the eye. We also needed to see where that selling happened and whether price stayed below the low.
Oil and metals needed confirmation, not predicted entries
Fahad wanted a good bearish close below the watched oil level before considering a short. He mapped a separate upside scenario after a liquidity sweep and VWAP reclaim or backtest. Gold had swept its lows and rallied, making a pullback into his marked area the preferred buy location. Silver had a bullish flag but no confirmed break.
Each chart needed its own response from price. The oil short looked unattractive without confirmation near the market bottom. Fahad's rule was plain: 'If we don't get the confirmation, we won't take the trade.'
Confirmation required across oil, gold and silver
| Instrument | Observed setup | Condition before action |
|---|---|---|
| Oil short | Price approached a watched level | A loss of that level and a good bearish close; no exact entry was stated |
| Oil upside scenario | A possible liquidity sweep and short squeeze | A VWAP reclaim or backtest after the sweep |
| Gold pullback | Lows swept, then price rallied | A return to Fahad's marked buying area; no exact price was stated |
| Silver flag | Smaller-timeframe bullish flag | A confirmed upside break, which had not occurred |
Gold gave us the sharpest reaction on the stream. Fahad noticed the recovery, but he still separated it from a fresh entry at an unspecified price. Our gold liquidity strategy using daily highs and lows covers the price-action idea behind waiting for a location.
One viewer was already long gold from 4,139, with a stated stop at 4,124. Fahad suggested reducing some of that existing position near resistance. Those were the viewer's position details, not fresh levels for our team. The oil chart below is a visual reference, not a map of Fahad's unpriced triggers.
◆ Interactive Lab
Open in new tab ↗Drive the order book yourself
HYPE's stop-out reinforced the cost of forcing a setup
Fahad said the HYPE trade was '100% wrong' after the attempt stopped out and the setup deteriorated. He later allowed for upside if price sustained above its first zone of interest, but did not call that confirmed. Our team paired the admission with his advice to mark zones, use alerts and limit trades.
A stopped-out idea stayed stopped out. Fahad's later upside thought was a separate possibility, not a reason to defend the earlier trade. HYPE was ranging, and its first zone of interest still needed to hold.
- Possible setup: HYPE sustaining above its first zone of interest could support an upside idea.
- Confirmation: ETH offered a possible short only if its 15-minute lows broke.
- Stopped-out trade: Fahad called the earlier HYPE attempt wrong.
The ETH chart below accompanies that conditional plan. Fahad did not give an exact price for the 15-minute low he wanted broken, so we have not treated a chart reference mark as his short trigger.
During the Q&A, Fahad suggested a limit of two trades a day. He advised marking zones and setting alerts instead of watching charts continuously. That advice landed differently after a stopped-out trade. Our piece on handling trading losses without revenge trades addresses the problem of accepting an invalidated idea before looking for another one.
◆ Interactive Lab
Open in new tab ↗Drive the order book yourself
Fahad's refusal to short BTC inside 85,400 to 86,000 stood out more than the bearish read itself. The order-flow data gave our team a reason to watch, but not a reason to enter. On the footprint, about $5 million of selling could not keep price below a swept low. We needed the candle's response to understand what the sellers had achieved. The HYPE stop-out was a reminder that waiting does not make every idea right, either. When a setup fails, we can leave it there and judge the next one on its own terms. Join the Hitpoint community for live market coverage and real-time trade alerts.
Watch the full stream: Why Bitcoin Rises While Open Interest Falls on YouTube
Disclaimer: This article is for educational purposes only and is not investment advice. The price levels, setups and trades described are a review of market events that have already occurred, shared to illustrate a method of analysis rather than to recommend any trade. Trading With Sidhant LLP is not a SEBI-registered Investment Adviser or Research Analyst, and nothing here constitutes a recommendation to buy or sell any security. Investments in securities markets are subject to market risks; read all the related documents carefully before investing. Past performance is not indicative of future results. Please consult a SEBI-registered financial adviser before acting on any information in this article.
Frequently Asked Questions
- Why can Bitcoin rise while open interest falls?
- Bitcoin can rise while open interest falls when existing positions close as price moves up, rather than new positions driving the move. On the stream, Fahad saw shorts being reduced while net longs failed to keep pace with rising **BTC**. We treated that combination as a sign of weak participation, not a complete explanation of every buyer behind the move.
- Does falling open interest mean Bitcoin is ready to short?
- No, falling open interest did not give our team an immediate **BTC** short. Fahad stayed neutral inside **85,400 to 86,000**, where a high-volume node was pausing price. He wanted the marked weakness area lost and confirming closes below it before considering a short. The order-flow divergence was a reason to pay attention, not an entry trigger.
- What does sideways CVD suggest when Bitcoin price moves higher?
- Sideways CVD alongside rising **BTC** suggested that aggressive buying was not increasing in step with price during this stream. Fahad checked that reading against falling open interest, lagging net longs and reduced shorts. We saw a rise with weak participation, but price still had to confirm weakness before the bearish read could become a short.
- How can heavy selling on a footprint candle precede a bounce?
- Heavy selling can precede a bounce when resting limit buy orders absorb market sell orders. Fahad showed a **five-minute BTC** candle that swept below a range low, then closed back above it. About **$5 million** of selling appeared within roughly **$9 million** in total volume. The recovery, rather than the selling figure alone, made the absorption visible.
- What confirmation did Fahad want before taking a Bitcoin short?
- Fahad wanted **BTC** to lose his marked weakness area and print confirming closes below it before considering a short. He did not give that area's exact price. While Bitcoin sat within **85,400 to 86,000**, our team stayed neutral despite the weak open-interest and CVD readings. A reclaim of his strength point would have shifted attention toward upside instead.
Share this post
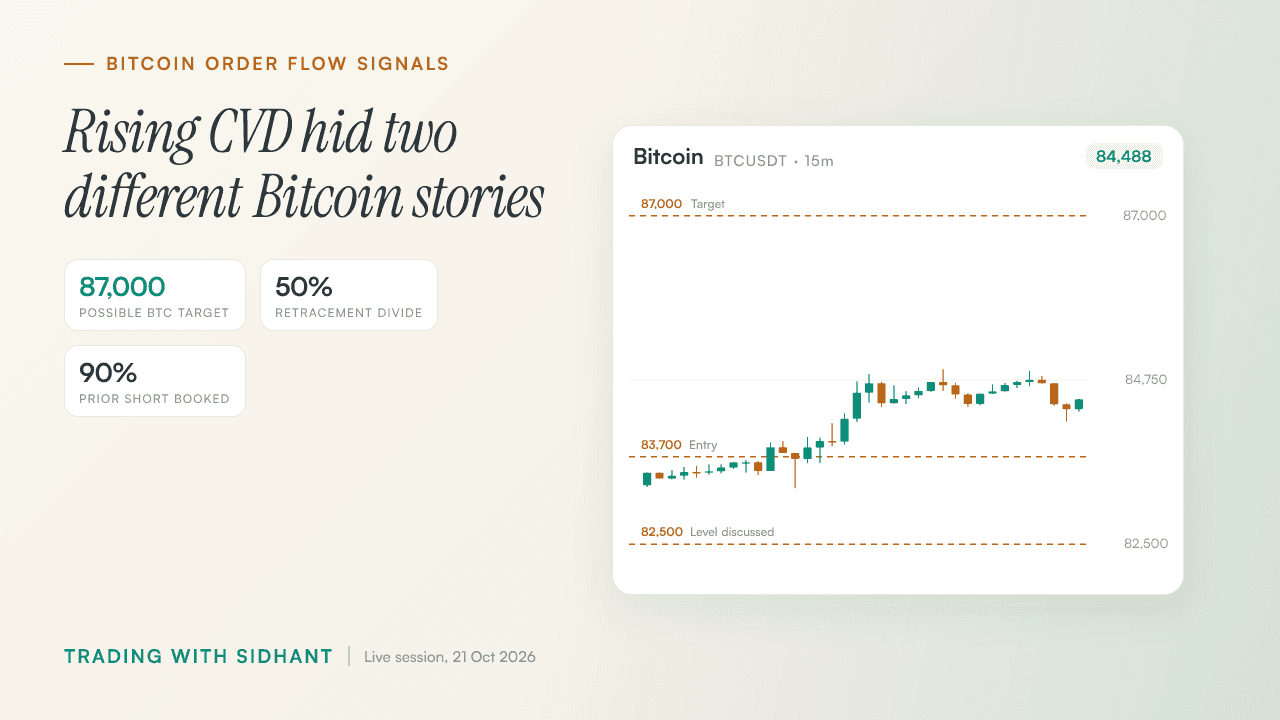
How to Read Bitcoin Open Interest and CVD Before 87,000
Rising CVD supported Fahad's Bitcoin upside bias, but a later drop in open interest changed what the buying meant.
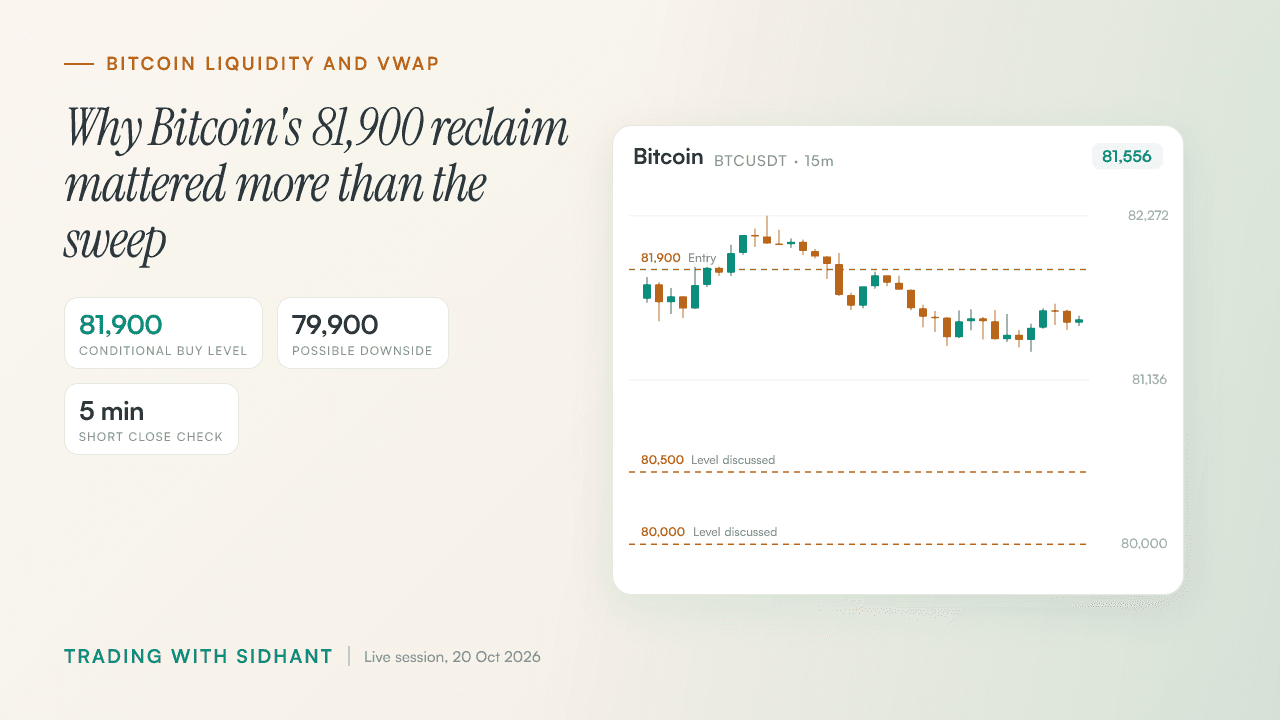
How to Trade Bitcoin Liquidity Sweeps Near 81,900
Bitcoin swept both sides of its range, but Fahad wanted an 81,900 reclaim to buy or a confirmed VWAP loss to short.
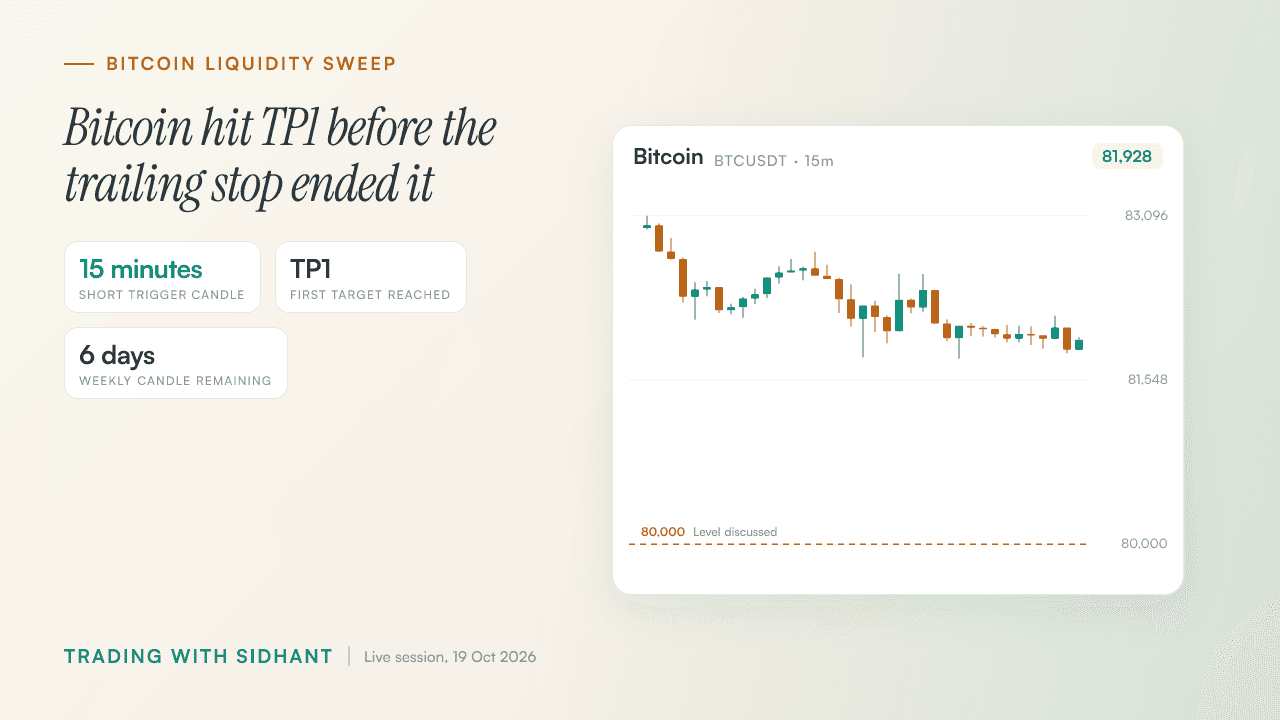
Bitcoin Liquidity Sweep Trading Strategy: TP1 and Stops
A Bitcoin short reached TP1, but the bigger lesson came from the trailing stop that ended the trade.
Get post alerts in your inbox.
New blog post? We'll email you. No spam, unsubscribe anytime.
Join our Telegram community.
Get post alerts, trading discussions, and market updates.