How to Read Footprint Chart Delta Without False Signals
A 15-minute candle showed -730 delta, but the real lesson is why aggressive orders can fail to move price.
7 min read

A 15-minute candle carried 10.19K contracts and -730 delta. Sellers were more aggressive, but that number alone does not say whether they moved price. That distinction is central to how to read footprint chart delta. As Sidhant puts it in the video, 'The candle is the result. Delta tells you who put in the effort.' We see the point again in his Bitcoin examples, where aggressive traders pressed at swing points and price moved against them. Our team starts with the candle and its level, then checks whether the footprint explains the result.
Key Takeaways
- A footprint display can teach the concept while still being too uncertain to trust for execution.
- Before calling a delta mismatch a trap, compare aggressive orders with the candle's actual close.
- The Bitcoin examples showed who failed at a swing point, but the footprint alone did not establish an entry.
- A meaningful area and a confirmed price response give a delta mismatch its context.
- An attractive reward ratio means little when the stop is unspecified and the next level leaves no room.
Footprint software is only as useful as its data
A footprint chart can help us study aggressive buying and selling, but access to one does not guarantee data we would trust for execution. In the video, Sidhant challenges a promised free solution, says TradingView footprints require a subscription and questions its tick-based commodity readings. Learning from a chart and trading from it are different decisions.
The free-chart claim drew a blunt response. 'He promised you a free solution and failed to deliver.' Sidhant names VOM, Bookmap, ATAS, MotiveWave and TradingView while discussing the available software. His accuracy figures are estimates, not results from a measured comparison.
Footprint data comparisons claimed in the video, not independently verified
| Data source | Accuracy claimed in video | Practical caveat |
|---|---|---|
| Free-chart data | About 80%, Sidhant's estimate | Useful for learning, but not a verified data-quality measure. |
| Paid TradingView data | About 95%, Sidhant's estimate | He cautions against relying on its commodity footprints for execution. |
| ATAS data | 100%, Sidhant's claim | The video supplies no benchmark for this absolute claim. |
We would not rank execution reliability from those percentages. Sidhant's caution is particularly relevant to the gold, silver and oil readings he discusses: an imperfect display may teach us what delta looks like without being dependable enough for an order.
Delta measures effort; the candle shows the result
Delta compares aggressive buying with aggressive selling, while the candle shows the price result. In Sidhant's 15-minute example, 5.46K aggressive sellers exceeded 4.73K aggressive buyers, producing -730 delta on 10.19K contracts. The video gives that calculation but does not specify the candle's direction, so we cannot judge the outcome from this example alone.
'Delta, sir, is just one word: effort.' Sellers crossed into bids, but we still need to see where price finished. The bar delta explanation provides background for the calculation. Sidhant's point is to compare that calculation with price, rather than treat its sign as an instruction.
How aggressive order flow compares with the candle result
| Delta | Candle result | What to investigate |
|---|---|---|
| Positive | Bearish | Buyers were aggressive, but price finished down. Investigate failed buying. |
| Negative | Bullish | Sellers were aggressive, but price finished up. Investigate failed selling. |
| -730 from 4.73K minus 5.46K | Not specified for this example | 10.19K contracts traded. Examine the candle before drawing a conclusion. |
A positive delta on a bearish candle can leave aggressive buyers trapped. With negative delta on a bullish candle, we would instead investigate failed selling. Neither mismatch supplies an entry. The distinction also matters when reading Bitcoin negative delta alongside rising open interest: first establish what traders did, then check what price did.
Bitcoin reversals showed trapped traders, not automatic entries
In the video, Sidhant shows Bitcoin buyers pressing near a swing high before price declines, then sellers failing near a bottom before a reversal. We read those as possible traps, not entries on their own. A trap may show on one candle, while absorption can develop across several as passive orders repeatedly meet aggressive trades.
Near the high, buyers hit the market, but a pin-bar-like rejection showed that price did not stay up. Sidhant says limit sell orders absorbed the buying and pushed price back down. At the bottom, aggressive sellers failed before price reversed. He gives no exact Bitcoin price for either example.
- Buyer trap: Aggressive buying near the high failed, and a decline followed.
- Seller trap: Aggressive selling near the bottom failed before price reversed.
- Multi-candle absorption: Passive orders repeatedly met one side's aggressive trades.
Many footprint displays emphasize market orders, so reading only delta can miss the passive orders taking the other side. The footprint cluster guide explains how trades appear within a footprint; Sidhant's pin bar shows why we also check the candle. Our crypto pin-bar entry discussion covers that price-action side. For our team, the useful observation is that aggression failed at both swing points, not that either footprint print called the reversal by itself.
A delta mismatch matters most at a meaningful level
Failed aggression tells us more when it appears at support, resistance, an order block, or a supply or demand zone. In the video, Sidhant checks whether price holds or rejects those areas after the footprint signal appears. We use the mismatch to assess a setup at a defined level, not to create a trade from an isolated candle.
'Footprint or order flow is not a trading strategy. It adds a super edge to your trading.' We take the first sentence as the working rule, not the second as a promised result. Sidhant rejects an isolated 5-minute candle as a good setup before examining its wider context.
At significant support, his example shows large negative delta while price holds and buyers take control. That made the selling effort worth investigating as a possible long setup. The level and price response mattered as much as the footprint, a useful distinction when studying Bitcoin resistance and order flow.
- Locate the level: Mark the relevant support, resistance, order block, supply zone or demand zone.
- Compare effort with result: Check whether aggressive orders actually moved price through that area.
- Wait for confirmation: Look for price to hold or reject the area and the opposing side to take control.
'Are you going to take a random trade everywhere just because you see absorption? No.' We would discard a dramatic print without a meaningful level. Confirmation at a Bitcoin value area follows the same discipline.
Targets and risk still depend on the next price level
A trapped-trader clue does not specify an entry, stop or target by itself. For the conditional Bitcoin examples, Sidhant discusses 1:2 or 1:3 risk-to-reward if the next relevant level allows it. The video gives no exact Bitcoin entry price or stop. We treat his probability and higher-risk remarks as commentary, not measured sizing rules.
The conditions differ by direction:
- Possible short: At a significant high, buyers face rejection and price confirms by breaking lower. The next relevant support limits the reward discussion.
- Possible long: At significant support, sellers fail to push price lower and buyers take control. The next relevant resistance limits the reward discussion.
Sidhant describes a 60% to 80% chance of a move when traders are trapped, but provides no performance record for that range. He also says a trader might double usual risk on a strong-looking setup. We would not turn either claim into a sizing rule, particularly when no stop is stated.
Risk check: Without an exact entry or stop, neither example is a complete trade plan. Our team looks at the next support or resistance to see whether the discussed reward ratio has room, not to assign a guaranteed destination to the move.
◆ Interactive Lab
Open in new tab ↗Drive the order book yourself
The clearest moment in the video comes when Sidhant puts delta beside the candle and asks whether the aggressive side got a price result. We can use that question at a Bitcoin swing point or a marked support level without turning every mismatch into a trade. His software accuracy figures remain estimates, while the -730 calculation is a concrete example of how delta is derived. Our team keeps those kinds of evidence separate. A footprint reading earns its place in the analysis when the candle and the surrounding level give us something specific to check. Join the Hitpoint community for live market coverage and real-time trade alerts.
Watch the full video: Booming Bulls Got It Wrong? | Order Flow Reality Check on YouTube
Disclaimer: This article is for educational purposes only and is not investment advice. The price levels, setups and trades described are a review of market events that have already occurred, shared to illustrate a method of analysis rather than to recommend any trade. Trading With Sidhant LLP is not a SEBI-registered Investment Adviser or Research Analyst, and nothing here constitutes a recommendation to buy or sell any security. Investments in securities markets are subject to market risks; read all the related documents carefully before investing. Past performance is not indicative of future results. Please consult a SEBI-registered financial adviser before acting on any information in this article.
Frequently Asked Questions
- What does delta tell you on a footprint chart?
- Delta tells you the difference between aggressive buying and aggressive selling for the measured area. In the video's **15-minute** example, **4.73K** aggressive buys minus **5.46K** aggressive sells produced **-730**. We read that as greater selling effort, then check the candle to see what the effort achieved. The negative number alone does not tell us where price closed.
- Why can a bearish candle have positive delta?
- A bearish candle can have positive delta when aggressive buyers trade more heavily than aggressive sellers but fail to keep price up. Sidhant uses that disagreement to explain a possible buyer trap: buying effort appeared in the footprint, while the candle finished bearish. We would examine the level and the following price response before deciding whether that failure is useful.
- What is the difference between a trapped trader and absorption?
- A trapped trader is on the aggressive side that failed to get the expected price result on a candle. Absorption describes passive orders meeting aggressive trades and can continue across multiple candles. In Sidhant's pin-bar example, limit sell orders met aggressive buying and price rejected the push. That rejection shows a possible buyer trap, but one candle does not establish a longer absorption process.
- Can I use TradingView footprint charts to trade commodities?
- TradingView footprints can help you study commodity order-flow concepts, but Sidhant cautions against relying on their readings for execution. He particularly questions the tick-based data discussed for **gold**, **silver** and **oil**. His approximate **95%** accuracy figure for paid TradingView data is an estimate, not a verified benchmark. We separate a chart used for learning from data trusted for placing an order.
- Is a delta mismatch enough to enter a Bitcoin trade?
- No, a delta mismatch alone does not establish a **Bitcoin** entry. Sidhant's swing examples pair failed buying or selling with a significant area and a confirming price move. The video gives neither exact Bitcoin entry prices nor stops. We read the mismatch as a reason to investigate who lost control, then check whether the level and candle support that reading.
Share this post
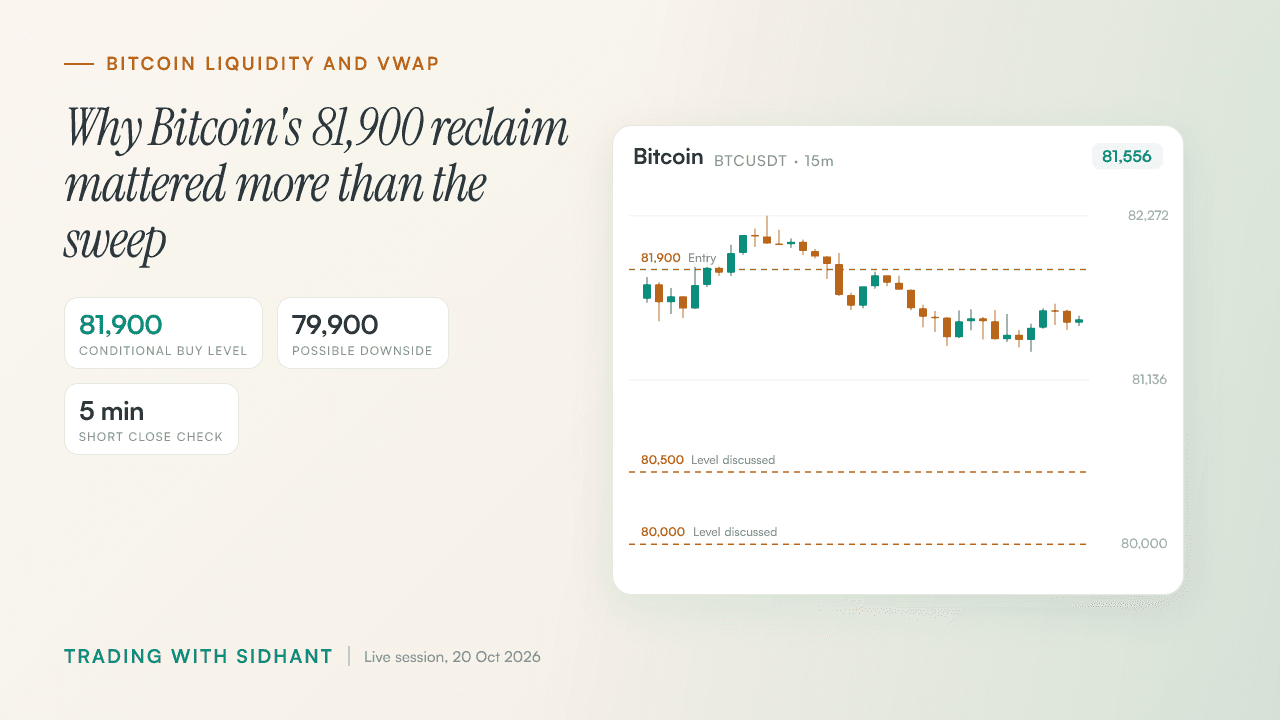
How to Trade Bitcoin Liquidity Sweeps Near 81,900
Bitcoin swept both sides of its range, but Fahad wanted an 81,900 reclaim to buy or a confirmed VWAP loss to short.
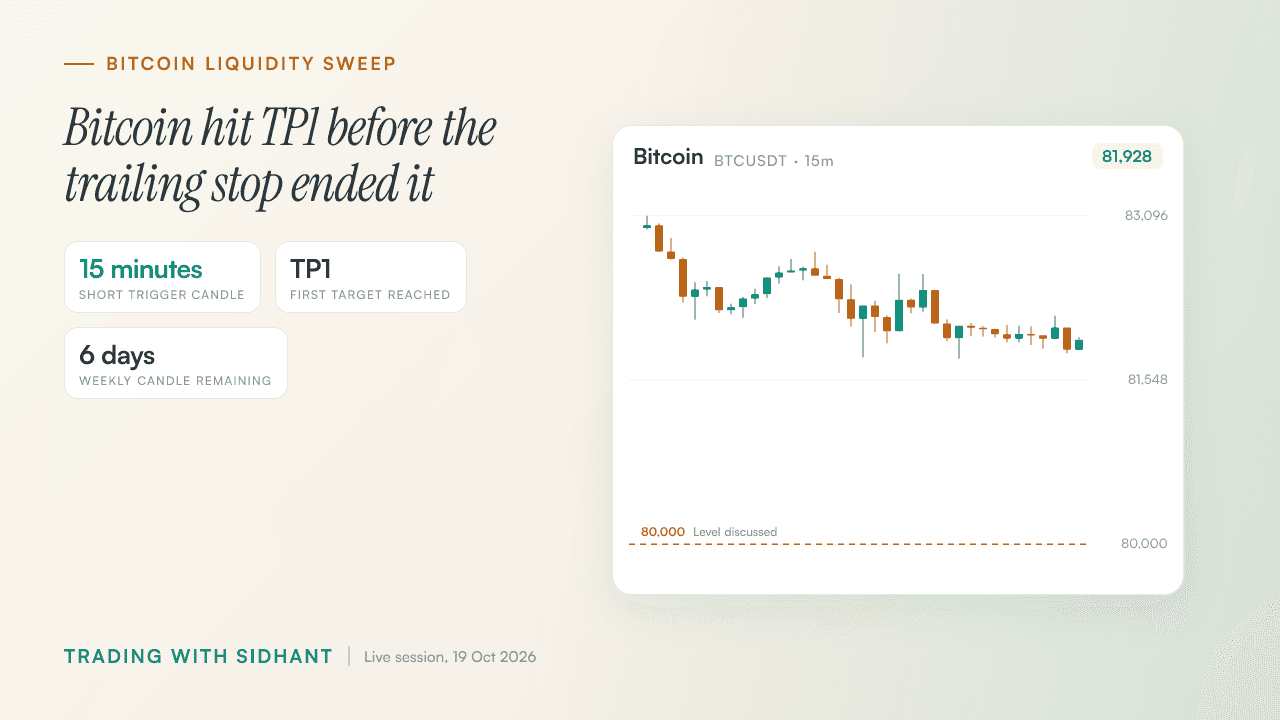
Bitcoin Liquidity Sweep Trading Strategy: TP1 and Stops
A Bitcoin short reached TP1, but the bigger lesson came from the trailing stop that ended the trade.
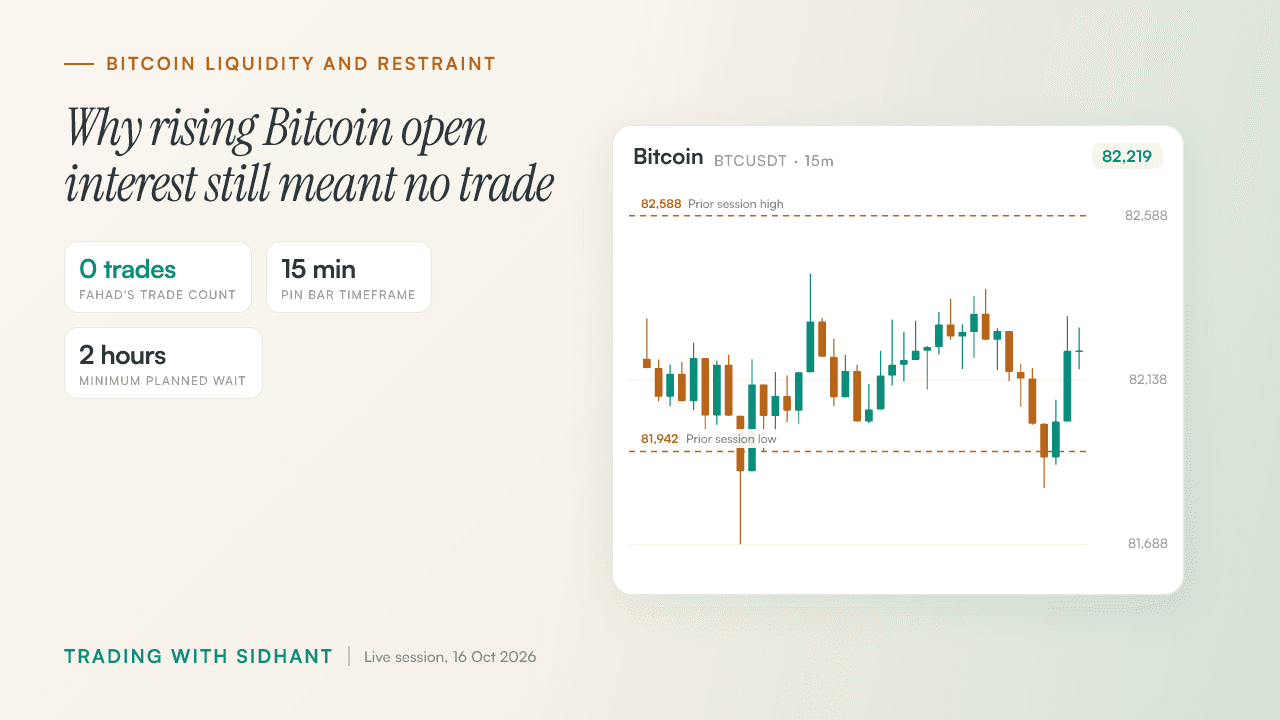
When Not to Trade Bitcoin: Rising OI, Zero Trades
Bitcoin open interest rose as CVD fell, but weak volume and conflicting signals kept Fahad out of the market.
Get post alerts in your inbox.
New blog post? We'll email you. No spam, unsubscribe anytime.
Join our Telegram community.
Get post alerts, trading discussions, and market updates.