Trade Bitcoin Liquidity Levels Like Our Team Does
Discover how Fahad and our team analyze Bitcoin's liquidity levels to enhance your trading strategies.
11 min read

Here's what stood out during our last session: Bitcoin was sitting right on a local liquidity level, and the team's read was clear, this was not the moment to jump in blind. Understanding how to trade Bitcoin liquidity levels is the difference between getting hunted by the market and actually hunting with it. Fahad called it out live: 'You're hitting a local liquidity level here. If I'm not wrong, it's a liquidity level.' That one observation shaped the entire session's approach. No impulsive entries. No chasing. Just watching the order flow tell its story. This post breaks down exactly how we think about liquidity zones, what they are, how we spot them, and what mistakes we see traders making over and over again.
Key Takeaways
- Liquidity zones are order magnets, not simple support/resistance, price visits them to collect orders, not necessarily to bounce.
- Mark liquidity zones before price arrives using swing structure, equal highs/lows, and session open levels, never reactively after the move.
- The sweep-and-reverse and confirmation-first approaches are the team's core liquidity strategies, skipping bad setups is itself a winning trade.
- Overleveraging at 'obvious' liquidity zones is the fastest way to be right about the level and still lose the trade.
- Fahad's most valuable lesson isn't a specific level, it's watching him skip bad setups and explaining exactly why the framework told him to wait.
What are Bitcoin liquidity levels?
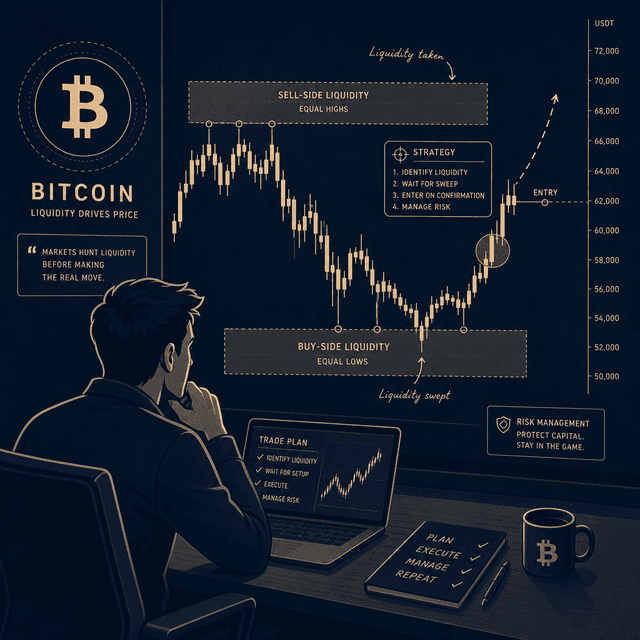
Bitcoin liquidity levels are price zones where a significant number of orders are concentrated, directly influencing how price moves through that area. Think of them as the market's hidden magnets, price doesn't wander randomly, it gets pulled toward these zones because that's where the money is sitting. When enough orders pile up at a specific level, the market will eventually come to collect them. That's the mechanism. That's what it is.
So, what creates these zones in the first place? A few things:
- Stop-loss clusters, retail traders place stops at obvious levels (round numbers, recent highs/lows). Those stops become liquidity for bigger players.
- Unfilled limit orders, institutions don't dump their entire position at once. They leave resting orders at key price zones.
- Past price reactions, anywhere price reversed sharply in the past, there's likely a concentration of orders still waiting.
During the session, Fahad pointed to exactly this dynamic on BTC. The price was approaching a local liquidity level, and rather than calling a direction immediately, the team watched. Waited. Because the first touch of a liquidity zone is rarely the cleanest entry, the market often sweeps through it briefly before reacting.
(And this is where it gets interesting.) Most traders look at a liquidity zone and think 'price will bounce here.' The smarter read is: 'price will come HERE to grab orders, and THEN we'll see what happens next.' That's a completely different mental model.
Why does this matter so much? Because if you don't understand what's below or above current price in terms of order concentration, you're essentially trading blind. You're reacting to candles instead of reading the order flow beneath them.
For a broader picture of how Bitcoin has been behaving at key technical levels recently, Bitcoin's position relative to major onchain support zones from CoinDesk gives useful context on just how far away meaningful support can be when liquidity thins out.
The team's approach has always been to mark these zones before the session starts. Not during the chaos. Before. 'Always mark the range because that is the range', and that range is defined by where liquidity lives on both sides of the current price.

How to identify liquidity zones in Bitcoin?
Identifying liquidity zones means analyzing past price actions and order concentrations to detect the areas where the market is most likely to react, before it gets there, not after. That's the key distinction. Reactive traders mark levels after the bounce. We mark them before price arrives.
Here's the honest process we use on stream:
Step 1: Mark swing highs and lows. Every significant high and low on the daily and 4H chart is a potential liquidity zone. Why? Because retail traders cluster their stops just above highs and just below lows. The market knows this.
Step 2: Look for equal highs and equal lows. Two or more touches at the same price level without a clean break? That's a liquidity magnet. Price will almost certainly revisit it.
Step 3: Identify consolidation ranges. Extended sideways movement means orders have been building up. When price finally breaks out of that range, it often comes back to test, and that retest is where the liquidity lives.
Step 4: Note the New York session open levels. The New York session is where the real volume kicks in. The levels established at the open frequently become the liquidity targets for the rest of the day.
Wait, actually... the most common mistake we see is traders treating liquidity zones as exact price points rather than zones. It's not '$67,000 exactly.' It's a range around that level. Price is messy. Give it room.
For traders who want to go deeper on reading order flow beneath the price action, mastering footprint charts and order flow analysis is worth studying alongside this.
Characteristics of Liquidity Zones
| Feature | Description |
|---|---|
| Location | Just above swing highs or below swing lows where stops cluster |
| Formation | Areas of equal highs/lows, consolidation ranges, or sharp reversals |
| Confirmation | High volume on approach, price reaction after sweep |
| Time frame | Most reliable on 4H and daily charts; refined on 1H |
| Behavior | Price sweeps through briefly before reversing, the 'stop hunt' |
| Invalidation | Clean break and hold above/below the zone with follow-through volume |
Trading like this will only make your understanding of price action much better. That's not just a motivational line, it's literally what happens when you spend sessions watching how price behaves around these zones instead of just reading indicators.

Bitcoin trading strategies around liquidity
Trading around liquidity zones means placing buy or sell orders based on expected price reactions at these levels, but the strategy has to match what the market is actually doing, not what you want it to do. Honestly? That second part is where most people fail.
The team ran through several setups during the session. Let's break down the core approaches:
Strategy 1: The Liquidity Sweep and Reverse Price sweeps below a key low (grabbing stops), then closes back above it. That close-back is your entry signal. The sweep was the trap. The close-back is confirmation. Fahad was explicit about this on stream, 'If you are short here, your SL will go somewhere, and this will be your TP one.' That's the mechanics of the sweep-and-reverse in one sentence.
Strategy 2: The Range Play When Bitcoin is stuck between two liquidity zones, you trade the range. Buy the lower zone, sell the upper zone. Simple. Boring. Effective. The session showed Bitcoin establishing its daily high and low without significant breakouts, a textbook range environment.
Strategy 3: Wait for Confirmation This is the one Fahad committed to on stream: 'Honestly? I'm not going to take the trade, and that's a good decision.' Skipping a trade because the setup isn't confirmed isn't weakness. It's the most disciplined move you can make. Understanding why confirmation matters before entering any trade is something we've covered in depth before.
Strategy 4: Options for Risk-Defined Plays For traders who want exposure around liquidity zones with capped downside, options strategies can work well. A recent CNBC analysis on Bitcoin's summer price action highlighted how bear call spreads on Bitcoin-linked instruments offered a 1:1 payoff ratio, useful when you have a directional bias but want defined risk.
Popular Bitcoin Trading Strategies
| Strategy | Description |
|---|---|
| Liquidity Sweep and Reverse | Enter after price sweeps a key level and closes back through it |
| Range Play | Buy lower liquidity zone, sell upper zone in a defined range |
| Confirmation Entry | Wait for a candle close confirming direction before entering |
| Breakout Retest | Enter on a retest of a broken liquidity zone after clean breakout |
| Options Spread | Use defined-risk options structures around major liquidity levels |
Look, the market was choppy this session. That's exactly when discipline around these strategies separates the traders who end the week green from the ones who end it frustrated.
For more on how Fahad has approached Bitcoin setups during volatile periods, Fahad's bold short plays during market turmoil is a good companion read.
Mistakes to avoid in Bitcoin liquidity trading
Avoiding mistakes like overleveraging and ignoring market conditions is non-negotiable when trading Bitcoin liquidity levels. These aren't soft suggestions. They're the difference between a strategy that compounds and one that blows up.
Here's what we see constantly, and it's painful every time:
Mistake 1: Overleveraging at liquidity zones. Because liquidity zones look like 'obvious' setups, traders size up. Big. Then the sweep goes further than expected and the position gets stopped out before the reversal happens. You were right about the zone. You were wrong about the size. That's a brutal combination.
Mistake 2: Treating the first touch as the entry. Price touching a liquidity zone once doesn't mean it's done there. The market sweeps, sometimes two or three times, before the real move starts. I mean... patience here isn't optional.
Mistake 3: Ignoring broader market conditions. During the session, Bitcoin wasn't showing significant directional movement. Trading a liquidity bounce setup in a choppy, directionless market is a low-probability play. The setup has to fit the conditions. Bitcoin's current technical positioning and what it means for traders from KITCO shows exactly why broader context matters, altcoin breadth weakening alongside Bitcoin pullbacks changes the risk picture entirely.
Mistake 4: No plan for the trade. Fahad said it clearly on stream, know where your stop goes and where your target is before you enter. 'If you are short here, your SL will go somewhere, and this will be your TP one.' If you can't answer those two questions before clicking the button, you're not ready to take the trade.
Mistake 5: Chasing after the sweep. The sweep happened. You missed the entry. So now you chase. You know what I mean? That's how you buy the top of the reversal instead of the bottom of the sweep. The setup is gone. Let it go. Another one is coming.
Right, the biggest meta-mistake is thinking liquidity trading is a shortcut. It's not. It's a framework that requires patience, discipline, and genuine screen time to internalize.

Enhance your Bitcoin trading with Fahad's insights
By following Fahad's insights and the team's live analysis, traders can sharpen their understanding of Bitcoin liquidity and build a more systematic approach to market analysis. This isn't about copying calls. It's about internalizing the framework so you can read the same setups independently.
What makes Fahad's approach different from generic Bitcoin content? A few things stand out from watching the sessions:
He calls the trade AND explains the mechanism. Not just 'Bitcoin is going down.' But why, which liquidity level is being targeted, what the order flow looks like, and what would invalidate the setup. That's the teaching that actually sticks.
He skips trades openly. 'Honestly? I'm not going to take the trade, and that's a good decision.' Watching a trader with conviction choose NOT to trade is more educational than watching a hundred entries. Most trading content shows you the wins. Fahad shows you the discipline.
He tracks the big moves. Oil was the standout this session, the team captured a long from $67, riding a 13% move. That's not luck. That's a pre-marked range, a patient entry, and the discipline to hold. 'Oil is, in my opinion, the most aggressive asset this week', and that read came from the same liquidity framework applied to Bitcoin.
For traders building their overall market analysis skills, understanding how to trade Bitcoin liquidity levels is just one piece. The Bitcoin market outlook and key levels for traders gives broader context on where the major zones sit across time frames.
You know, that's interesting, the same liquidity logic Fahad applies to Bitcoin works across assets. The oil trade this session was proof. The framework is transferable. That's what makes it worth learning properly rather than just memorizing levels.
Timing your entries around key Bitcoin trading sessions is the natural next step, because even the best liquidity zone setup fails if you're trading it at the wrong time of day.
The team's goal on every stream is simple: show the analysis, show the reasoning, show when we pass on a trade, and let the viewers build their own system from watching. That's it.

So what did this session actually teach us about how to trade Bitcoin liquidity levels? A lot, and most of it wasn't about Bitcoin specifically. It was about discipline.
Here's what we're taking away:
- Mark zones before the session, not during it. Reactive level-marking is just storytelling after the fact.
- The sweep is not the entry. Wait for price to close back through the zone before committing.
- Choppy conditions are a signal to reduce size or skip entirely. Not every day needs a trade.
- Overleveraging at 'obvious' setups is the most common way to be right and still lose money. Size appropriately.
- The mechanism matters more than the level. Understanding WHY price reacts at a liquidity zone makes you adaptable across market conditions.
Fahad's energy this session was exactly what the team needed, grounded, patient, and honest about when the setup wasn't there. That's the standard we hold ourselves to.
Join the Hitpoint community for live market coverage and real-time trade alerts, watch these setups unfold in real time, not just in recap posts.
Watch the full stream: LIVE: Trading BTC, Gold, Silver | Orderflow & Footprint on YouTube
Disclaimer: This article is for educational purposes only and is not investment advice. Crypto assets are unregulated in India, are highly volatile, and can lose value rapidly; there is no established investor-protection or grievance-redressal mechanism for them. Trading With Sidhant LLP is not a SEBI-registered Investment Adviser or Research Analyst, and nothing here constitutes a recommendation to buy or sell any asset. Income from virtual digital assets is taxable in India at 30% plus applicable cess, with 1% TDS on transfers. Past performance is not indicative of future results. Do your own research before trading.
Frequently Asked Questions
- What are liquidity levels in Bitcoin trading?
- Liquidity levels in Bitcoin trading are price zones where a high concentration of orders, stops, limit orders, and institutional resting orders, are clustered. These zones act as magnets for price because the market moves toward them to fill those orders. They form around swing highs and lows, equal price touches, and areas of extended consolidation where orders have built up over time.
- How can I identify liquidity zones in crypto markets?
- Identify liquidity zones by marking swing highs and lows on the 4H and daily charts, looking for equal highs or equal lows (multiple touches at the same price without a clean break), and noting consolidation ranges where price moved sideways for extended periods. New York session open levels are also reliable targets. The key is marking these zones before price arrives, not after the reaction has already happened.
- What strategies can enhance Bitcoin trading efficiency?
- The most effective strategies around Bitcoin liquidity involve the sweep-and-reverse (entering after price sweeps a key level and closes back through it), range plays between two defined liquidity zones, and confirmation-first entries that require a candle close before committing. Skipping low-probability setups in choppy conditions, as Fahad demonstrated live, is itself a core efficiency strategy that most traders undervalue.
- How does liquidity affect Bitcoin price action?
- Liquidity directly drives Bitcoin's price movements by creating zones that price is pulled toward to fill resting orders. When Bitcoin approaches a high-liquidity zone, it frequently sweeps through it briefly, triggering stops and filling limit orders, before reversing. This 'stop hunt' behavior is not random. It's the market's mechanism for filling large orders efficiently, and understanding it changes how you read every candle near a key level.
- What are common mistakes in trading Bitcoin liquidity?
- The most damaging mistakes include overleveraging at liquidity zones because the setup looks obvious, treating the first touch of a zone as a confirmed entry, ignoring broader market conditions (trading a bounce setup in a choppy, directionless market), entering without a pre-defined stop and target, and chasing price after the initial sweep has already occurred. Each of these mistakes is avoidable with a clear framework and genuine patience before clicking the entry button.
Share this post

How to Use Direction Area Trigger in Nifty Trading
A Nifty short near 24,000 needed more than a pin bar: daily bias, a defined area and footprint evidence had to agree.
Bitcoin Order Flow Analysis After a Rally
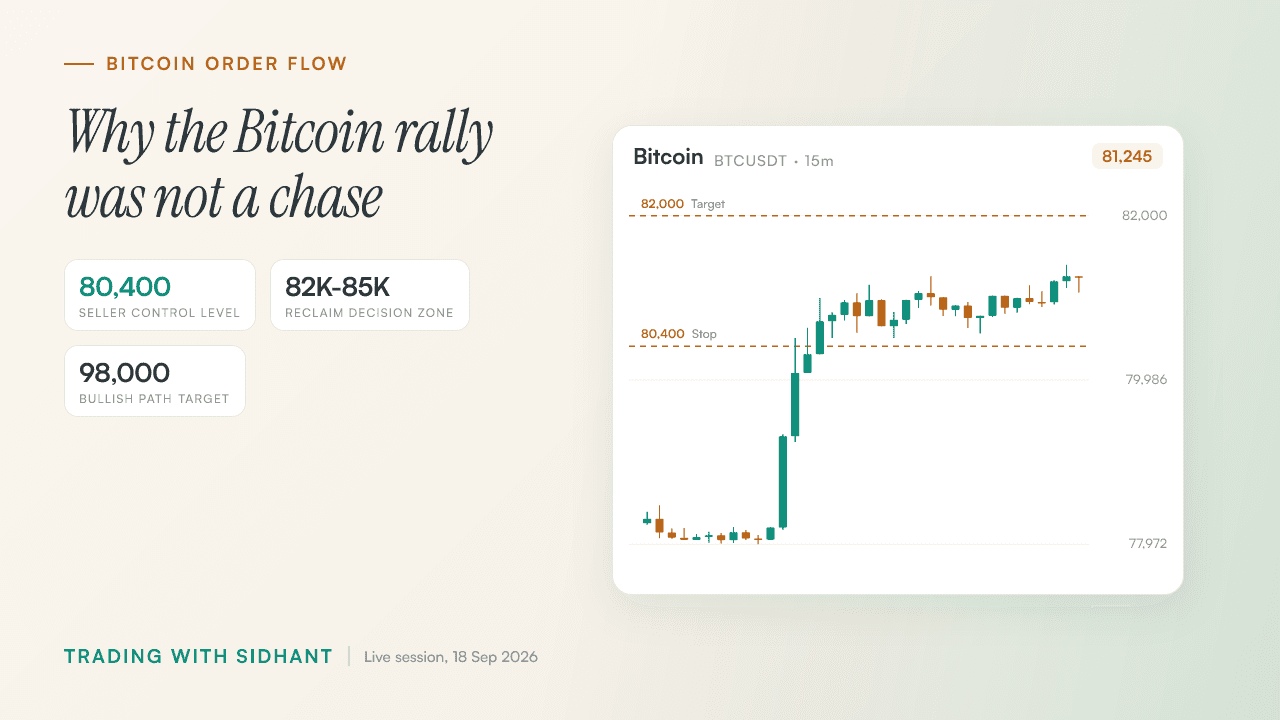
Bitcoin had already rallied, so Fahad used 80,400, delta and seller exhaustion to explain why waiting beat a FOMO entry.

When to Quit a Profitable Intraday Strategy
Rs 12 lakh in profit looked different after Sidhant counted the 1,500 hours and the freedom the strategy had consumed.
Get post alerts in your inbox.
New blog post? We'll email you. No spam, unsubscribe anytime.
Join our Telegram community.
Get post alerts, trading discussions, and market updates.