How to Read Bitcoin Open Interest and CVD When Price Rises
Bitcoin's price rose while open interest fell and CVD stayed flat, putting the apparent buying strength in doubt.
8 min read
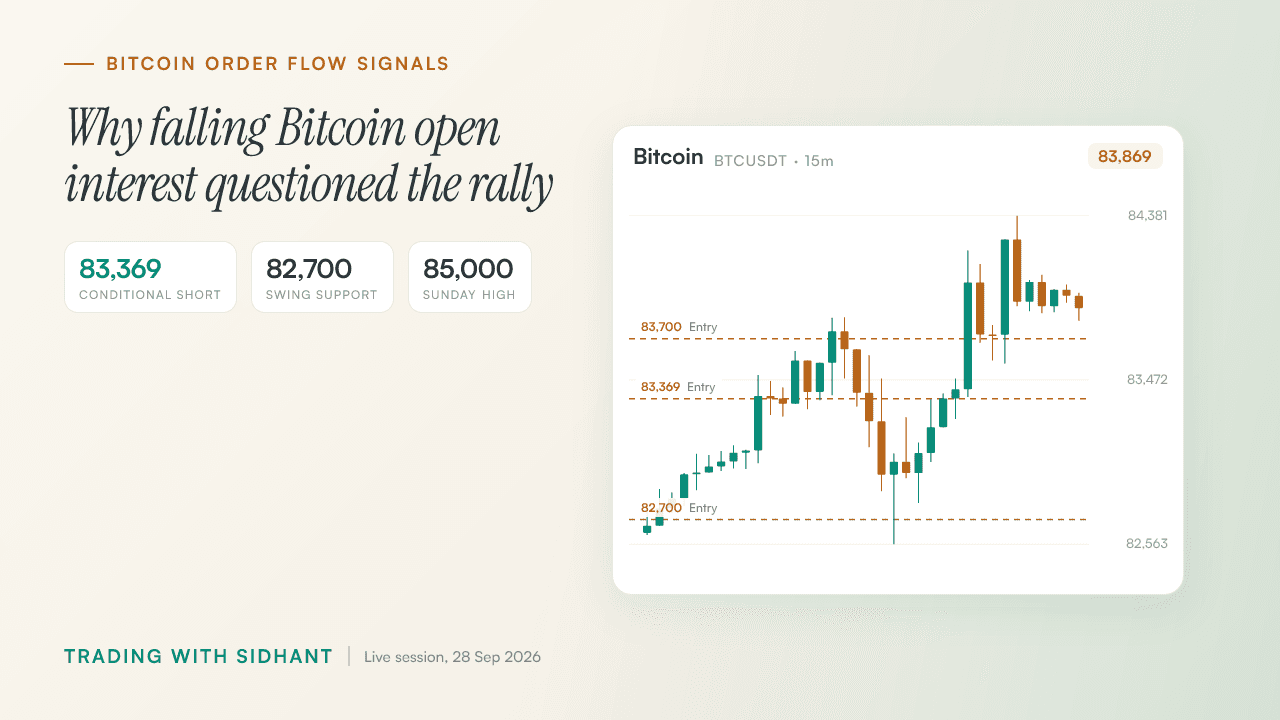
Bitcoin was rising, but our team could not tell from price alone who was buying. On the stream, Fahad showed the five-minute chart: open interest was falling, CVD was broadly sideways and net longs were mostly flat. That is why how to read bitcoin open interest and cvd mattered more than the green candle. Our planned reversal had already reached TP1. Fahad did not treat that as a reason to rush into another trade: 'I wouldn't want to rush. I'd rather wait for the second setup.'
Key Takeaways
- Reaching TP1 rewarded the planned reversal, not an immediate second entry.
- A short exit can lift price without proving that fresh longs have taken control.
- A level only makes sense with its timeframe, trigger and invalidation.
- Gold had a priced trigger while oil and silver remained conditional ideas with missing levels.
- Pay for a feed only when you know which decision its data will change.
Bitcoin reached TP1, but the day's midpoint called for patience
Our planned Bitcoin reversal reached its first target, but Fahad did not treat that result as permission to chase another move. Bitcoin, gold, silver and oil were each near 50% of their daily move. With traders divided between continuation and reversal, he preferred waiting for a second setup.
One good trade did not make the next entry good.
- We had posted the reversal in advance, taken the trade and reached TP1. Fahad gave no price for that first target.
- For a possible follow-up short, Fahad preferred a safer second setup over an earlier, riskier entry.
- He called the 50% midpoint the 'make-it-or-break-it zone' across all four markets.
At that midpoint, one trader could see the earlier move resuming while another saw a pullback before continuation. Neither reading settled the next entry. Our discussion of waiting for confirmation in a Bitcoin value area covers the same entry discipline.
The oil chart below shows 15-minute candles from the stream. It does not mark the 50% midpoint Fahad discussed.
◆ Interactive Lab
Open in new tab ↗Drive the order book yourself
Rising Bitcoin price with falling open interest did not prove fresh buying
On the five-minute Bitcoin chart, price rose while open interest fell and CVD stayed broadly sideways. Net longs were mostly sideways too. Fahad questioned whether new longs were driving the move. A short seller buys to close a position, so buying activity on its own does not establish a new long.
A buy print needs context. Price can lift as shorts exit even when evidence of fresh long positions is thin. Fahad put it plainly: 'Absorption can never be determined by just looking at the delta.' Our example of Bitcoin price rising as open interest falls examines that distinction.
Bitcoin order-flow observations and what they can establish
| Observed price action | Supporting data | What the reading does and does not show |
|---|---|---|
| BTC rose on the five-minute chart | Open interest fell while CVD and net longs were broadly sideways | Short covering was plausible. Fresh buying was not established. |
| BTC moved sideways later | Negative delta and rising short activity | Sellers were active, but price made no decisive move. Fahad gave no open-interest reading for this later range. |
| A candle showed buying or selling pressure | Delta on its own | Delta described executed activity. It could not establish absorption without other readings. |
In that later range, Fahad saw negative delta and increasing short activity without a decisive price move. We did not turn those prints into an absorption call. The distinction discussed in negative Bitcoin delta and rising open interest matters because the readings answer different questions.
A separate report of a 14% fall in Bitcoin open interest described positions shifting toward spot trading. That figure was not a measurement from our stream. On Fahad's chart, rising price alone could not identify who was buying.
83,369 set the Bitcoin short trigger; 82,700 held the swing view
Fahad separated two Bitcoin ideas by timeframe. An intraday short required a loss of 83,369, with the range bottom and then the lows as destinations. His swing view remained constructive above 82,700, with a reclaim of 83,700 strengthening the case for revisiting Sunday's 85,000 high. A daily close below 82,700 invalidated that view.
The short and the swing view were different setups.
Bitcoin levels by setup and timeframe
| Level | Setup | Condition or role |
|---|---|---|
| 83,369 | Intraday short | A loss of the level was the conditional trigger. The range bottom came first, then the lows. |
| 82,700 | Swing view | Support while price held above it. A daily close below invalidated the bullish case. |
| 83,700 | Swing view | A reclaim would strengthen the case for an upside move. |
| 85,000 | Swing view | Sunday's high and a possible revisit area, not a reached target on this stream. |
Fahad gave no numerical stop for the intraday short and no prices for its range-bottom or lows targets. He pointed to a stop area on the chart, but we cannot turn that into a number. He also preferred waiting for the safer second setup.
For the swing idea, Fahad said Monday or Tuesday might take out the weekend range's high or low. That was a separate timeframe from the conditional intraday short. The Bitcoin resistance and order-flow discussion offers more context for keeping a level tied to its setup.
The chart below marks all four stated levels on 15-minute candles. A separate Bitcoin report does not establish that Fahad's 85,000 Sunday-high target was reached on this stream.
◆ Interactive Lab
Open in new tab ↗Drive the order book yourself
Gold needed a break of 4,144; oil and silver lacked firm levels
Fahad saw gold as bearish in the wider picture, but he held back from shorting its pause near a previous range high. He wanted a confirmed loss of 4,144 first. 4,100 was the next area, with 3,981 relevant only if that support failed. Oil and silver had less precise conditions.
Gold had a priced trigger, not an immediate short. Price was backtesting the previous range high after a decline, and Fahad did not see momentum for an entry yet. He suggested watching the 15-minute chart for the 4,144 break. Later, gold moved in the direction he had discussed, but the stream did not establish a completed gold trade.
Conditional short ideas across gold, oil and silver
| Market | Required confirmation | Stated downside area or limitation |
|---|---|---|
| Gold | Confirmed loss of 4,144 on the 15-minute view | 4,100, then 3,981 only if 4,100 failed. |
| Oil | A five-minute loss of the current or next candle's low | No exact trigger price or short target was stated. |
| Silver | No priced entry condition was stated | Fahad saw a possible quick short, with no entry, target or stop given. |
Earlier, Fahad found no major local oil sweep worth trading. Later, he described a possible candle-low trigger, though the reaction had not convinced him. Silver was a quick in-and-out possibility rather than a fully specified setup. Our guide to confirmation in trading also separates an idea from an entry.
The gold chart below marks 4,144, 4,100 and 3,981. Those lines show the levels discussed, not an executed short.
◆ Interactive Lab
Open in new tab ↗Drive the order book yourself
A trading framework must come before paid order-flow data
Our team would define the setup before paying for more order-flow data. Fahad urged traders to learn where a feed comes from, understand the tools they already have and check whether a reading changes a trade decision. For a viewer's trap-candle setup, he suggested a minimum 1:2 risk-reward ratio.
More data cannot make an undefined setup precise. Fahad compared buying an advanced feed without a system to receiving the engine of the best car when you do not own a car. The engine may be excellent. There is still nowhere useful to put it.
- Check where actual trading and liquidity occur. A broker front end is not automatically the source of either.
- Understand Bookmap's own data before buying or copying another tool. Fahad also pointed viewers to free lessons on footprint, open interest and CVD.
- Test whether a reading improves an existing setup, including its risk and exit. For the viewer's trap-candle example, Fahad's minimum was 1:2.
Fahad also warned that a poorly explained loss can cost a viewer confidence as well as money. Our footprint delta guide is useful practice, but the reading still needs a decision attached to it. Otherwise, we risk repeating the same mistake with a more expensive screen.
The moment that stayed with our team was Fahad stopping at a rising Bitcoin candle to examine the buying behind it. Falling open interest, sideways CVD and mostly flat net longs gave us reason to question fresh demand without claiming the data proved a short. That restraint shaped the rest of the stream. Fahad named conditions where he had them and left oil and silver unpriced where he did not. Audio problems cut the discussion short, but the distinction between seeing activity and knowing what caused it was clear. Join the Hitpoint community for live market coverage and real-time trade alerts.
Watch the full stream: How to Read Bitcoin Open Interest and CVD When Price Rises on YouTube
Disclaimer: This article is for educational purposes only and is not investment advice. The price levels, setups and trades described are a review of market events that have already occurred, shared to illustrate a method of analysis rather than to recommend any trade. Trading With Sidhant LLP is not a SEBI-registered Investment Adviser or Research Analyst, and nothing here constitutes a recommendation to buy or sell any security. Investments in securities markets are subject to market risks; read all the related documents carefully before investing. Past performance is not indicative of future results. Please consult a SEBI-registered financial adviser before acting on any information in this article.
Frequently Asked Questions
- What does it mean when Bitcoin rises while open interest falls?
- It can mean existing shorts are closing rather than new longs opening. Closing a short requires buying, so price can rise as open interest drops. On our five-minute chart, CVD and net longs were also broadly sideways. Fahad treated that combination as a reason to question fresh demand, not as proof of exactly which traders had exited.
- Can delta alone confirm absorption in Bitcoin?
- No, delta alone cannot confirm absorption. Fahad said so directly on the stream. Delta shows executed buying or selling pressure, but it does not identify whether a buy came from a new long or a short closing. Our team checked price, open interest and CVD together before interpreting the move.
- What would invalidate the Bitcoin swing-long view above 82,700?
- A daily close below **82,700** would invalidate Fahad's swing-long view. He treated holding above that level as supportive of a possible revisit to Sunday's **85,000** high, with a reclaim of **83,700** adding strength to the case. The daily-close condition belonged to the swing timeframe, not the separate intraday short.
- When did Fahad consider a Bitcoin short below 83,369?
- Fahad considered the intraday short only after **Bitcoin** lost **83,369**. He identified the bottom of the range first and then the lows, without giving prices for either destination or a numerical stop. He did not want to rush the earlier, riskier entry and said he preferred waiting for a safer second setup.
- Why did Fahad wait for gold to break 4,144 before considering a short?
- Fahad waited because **gold** was pausing at a backtest of the previous range high, and he did not see enough momentum for an immediate short. A confirmed loss of **4,144** on the **15-minute** view was his condition. He named **4,100** as the next area and **3,981** only if **4,100** failed.
Share this post
How to Read Bitcoin Open Interest and CVD Before 87,000
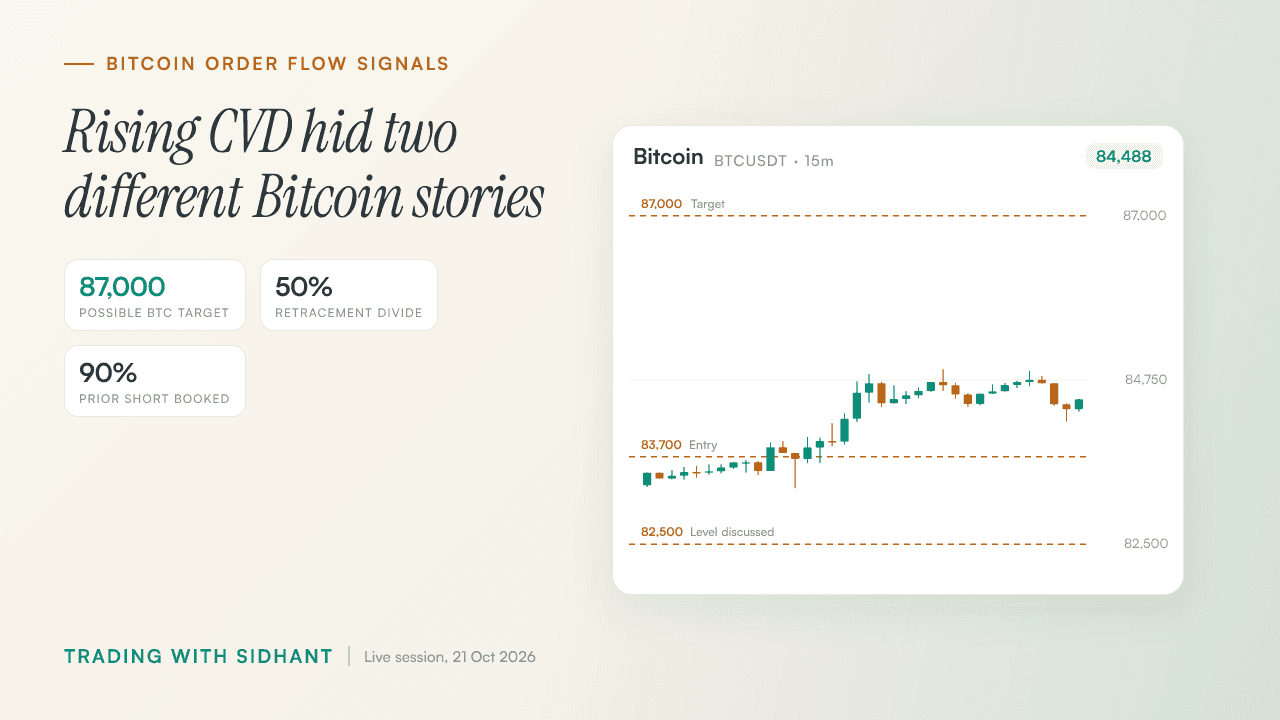
Rising CVD supported Fahad's Bitcoin upside bias, but a later drop in open interest changed what the buying meant.
How to Trade Bitcoin Liquidity Sweeps Near 81,900
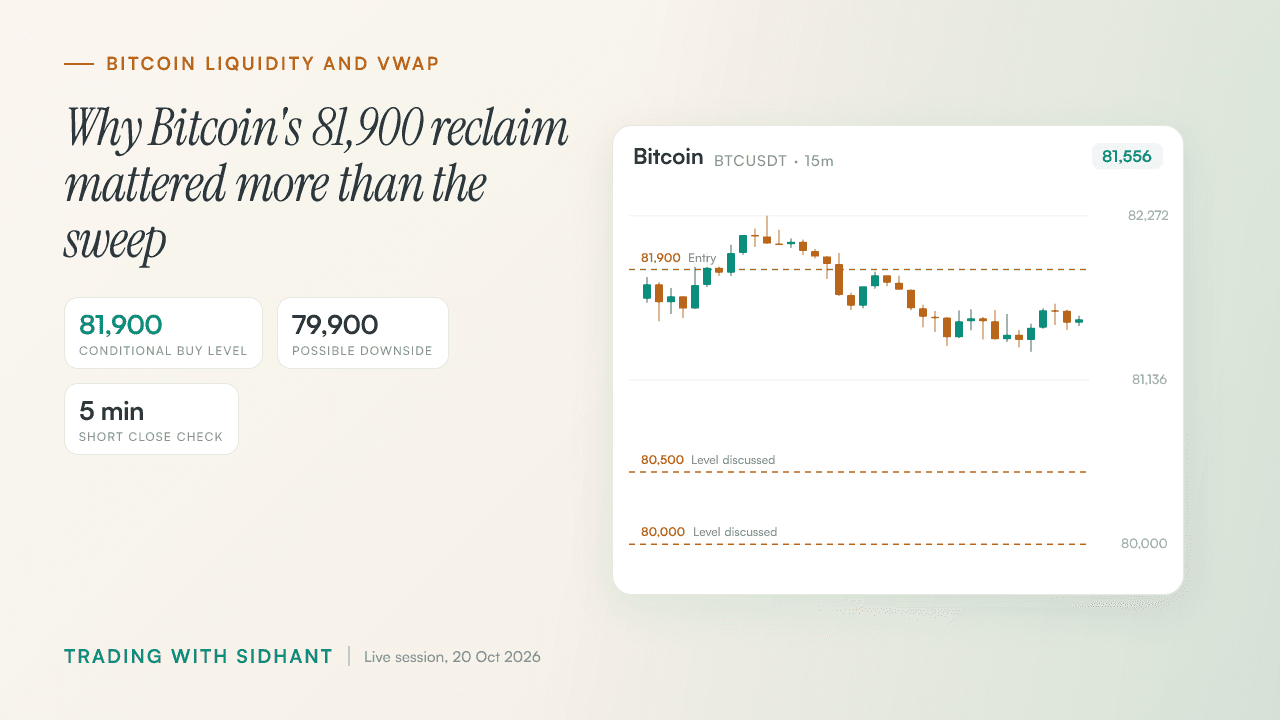
Bitcoin swept both sides of its range, but Fahad wanted an 81,900 reclaim to buy or a confirmed VWAP loss to short.
Bitcoin Liquidity Sweep Trading Strategy: TP1 and Stops
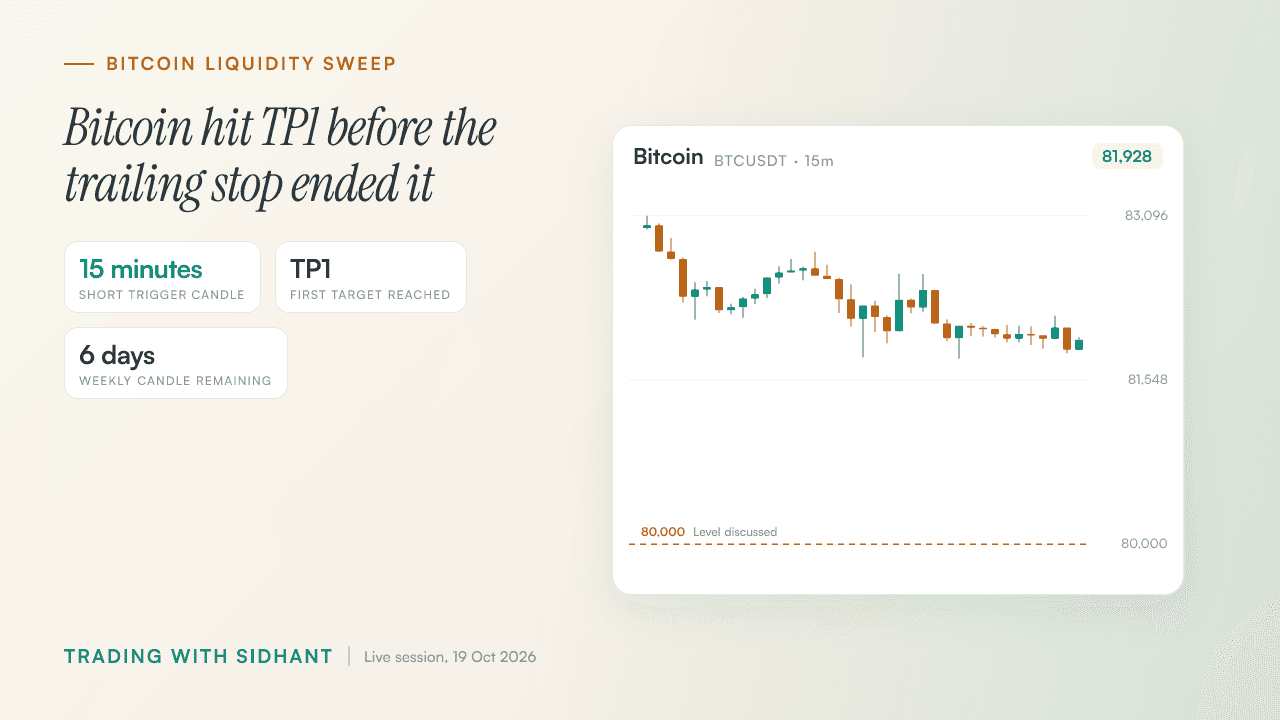
A Bitcoin short reached TP1, but the bigger lesson came from the trailing stop that ended the trade.
Get post alerts in your inbox.
New blog post? We'll email you. No spam, unsubscribe anytime.
Join our Telegram community.
Get post alerts, trading discussions, and market updates.