Bitcoin weekly support and resistance levels to watch
BTC still has upside liquidity at 82.7, but a confirmed loss of 76.6 can reopen the path toward 67,000.
8 min read

Bitcoin is sitting on a weekly structure that still has unfinished business at 82.7, and our team spent the entire stream mapping out exactly where that story breaks or continues. The bitcoin weekly support and resistance levels that matter right now are 76.6, 78.4, and 82.7, and Fahad was direct about it: "I am not going to plan a reversal just based on this candle." One indecisive weekly candle is not a reversal. But a confirmed 4H close below 76.6 is a completely different conversation, one that reopens the path toward 67,000. Here is the full map.
Key Takeaways
- One indecisive weekly candle is not bearish confirmation. The 82.7 liquidity target stays live until structure breaks below 76.6.
- A 4H candle close below 76.4 is the specific trigger that converts a possible bearish bias into an actionable bearish map.
- Price sweeping 79.3 is expected. The short only becomes valid after a lower-timeframe structure break confirms the reversal.
- Distribution and accumulation look identical inside the range; only the break and close outside it gives you the answer.
- ETH mirrors BTC, so waiting for Bitcoin to confirm direction first eliminates the need to make two uncertain calls at once.
82.7 remains the upside liquidity magnet until BTC clearly fails lower
BTC still carries an unfinished upside path toward 82.7 because the weekly move has not produced enough structural proof for a reversal. Fahad treated the latest candle as indecisive, not bearish confirmation. Respect the higher liquidity draw until lower levels decisively fail.
A bullish impulse followed by one sideways, wick-heavy candle is not a top. It is a pause. Fahad was clear on the stream: "I am not going to plan a reversal just based on this candle."
Fahad's custom money-flow indicator was showing outflows on the weekly timeframe. Early warning, not final proof. Price can show outflows and still grind toward a liquidity level before turning, and calling a top before the market proves it is exactly how traders get squeezed.
Distribution is possible, and our team is not dismissing it. But it has to be confirmed by where price goes next, not assumed from a single candle shape.
Price hit $79,000 in a short-squeeze driven rally, the biggest single move since 2023, which tells you there is still active positioning on both sides of this market.
For a deeper look at how our team approaches liquidity levels in BTC, see how we trade Bitcoin liquidity levels.
Bitcoin weekly map from the stream
| Level or condition | What our team would infer |
|---|---|
| 82.7 upside liquidity | Still live. Price has not swept it yet, upside bias remains valid |
| 78.8 resistance area | Shorts only become valid after this area is taken out on a lower-timeframe confirmation |
| 76.6 deciding support | The line between two scenarios. Above it, upside remains open |
| 76.4 break zone | A 4H candle close below here shifts the map to bearish |
| Downside path below 76.4 | 67,000 to 68,000 become the next reference points |
76.6 is the deciding weekly level, and a 4H close below changes the trade map
Fahad named one clear bearish trigger: a confirmed 4H candle close below the 76.6 to 76.4 area. Our team read this as a rules-based shift, where above that zone, upside remains valid, and below it, the path toward 67,000 to 68,000 reopens.
Fahad was direct: no shorts until structure confirms weakness, which rules out random fading into strength or any "I think this looks like a top" trade. The only valid trigger is a 4H candle close below 76.4.
Why 4H? A wick below a level and a close below a level are completely different things. A wick is a test. A close is proof that price sustained the break through an entire four-hour period.
BTC's ability to hold above its 52-week moving average has been a key factor separating the bull and bear scenarios in recent weeks, and the 76.6 zone sits right in that contested territory.
For traders building a bearish framework, the full short thesis is covered in bearish trading strategies for Bitcoin in 2026.
- Above 76.6: upside toward 82.7 stays valid
- 4H close below 76.4: trade map flips, downside toward 67,000-68,000 is the reference
- Shorting before confirmation: not part of Fahad's plan
The weekend high near 79.3 is a sweep zone, not an automatic short
Around the weekend high near 79.3, the setup was framed as a likely liquidity sweep before any serious short appears. Our team found that Fahad wanted a bearish pin bar or a clear lower-timeframe loss of structure first, while still keeping 78.2 in mind as a possible long zone if Bitcoin reacts cleanly.
Many traders see a weekend high and assume it is resistance, then short it. Fahad's read: the market sweeps that high first, takes out the stops sitting above it, and then reverses. Fading before the sweep is the wrong sequence.
On the 5-minute timeframe, the confirmation he wanted was lower lows and lower highs after the sweep, or a clear bearish pin bar at the high. Without that, the weekend high is just a number on a chart.
78.4 acts as a local structure reference between the two zones. 78.2 is where a clean long could make sense if BTC pulls back and shows a reaction rather than a breakdown.
Understanding how confirmation changes a trade is the difference between a disciplined setup and a guess.
How our team would treat the local BTC zones from the stream
| Zone | Preferred reaction |
|---|---|
| 79.3 weekend high sweep zone | Wait for the sweep to happen, then look for a bearish pin bar or lower-timeframe breakdown before shorting |
| 78.4 local structure area | Watch for rejection or break; not a standalone trade trigger |
| 78.2 possible long zone | Valid only on a clean pullback with a clear bullish reaction, not a blind buy |

Distribution is possible, but accumulation versus distribution must be proved by the break
A weekly range becomes distribution only when it breaks down and sustains below the right support, while accumulation proves itself by holding and breaking upward. Our team spotted that Fahad used this distinction to slow traders down: the candle alone was not enough, and the market had to reveal intent through structure and liquidity behavior.
Sideways ranges after a strong move can resolve either way. A break up that holds is accumulation. A break down that sustains below support is distribution, and you cannot know which is playing out while price is still inside the range.
Fahad put it plainly: "The market is pushing, which according to me is a good sign." Upward pressure, not confirmed selling.
His money-flow indicator showed outflows on the weekly, an early warning. He also said, "If your market has to pump, these three days will be more than enough," referring to Monday through Wednesday as the window where a move toward 82.7 could still materialize.
For a broader look at how our team applies this thinking across BTC setups, the Bitcoin market analysis and trading strategy insights for 2026 post covers the framework in more depth.
- Accumulation: range holds and breaks upward
- Distribution: range breaks down and sustains below support

Patience beats random retail shorting when Bitcoin, ETH and correlated trades are still waiting for confirmation
Traders should wait for confirmation instead of selling into strength without a reason. Our team heard Fahad repeat that Ethereum often mirrors Bitcoin, so the cleaner plan is to let BTC prove weakness near the key levels first, then decide whether shorts, longs, or no trade offer the better risk.
Fahad said it directly: fading a pumping market without confirmation is not a strategy. That is gambling. "You are not supposed to be making profits just as a random retailer" was his framing for why most participants get this wrong.
ETH is not an independent trade right now. It mirrors the BTC structure. Doubling up on ETH shorts while BTC has not confirmed is just doubling the exposure to the same unconfirmed thesis.
The plan is simple:
- Let BTC prove the direction at 76.6 or 79.3
- ETH follows; trade it after BTC confirms, not before
- No trade is a valid position when confirmation is absent
For live coverage as these levels play out, join the Hitpoint community for real-time market analysis and trade alerts.

The stream gave us a clear map and a clear set of rules. Here is what stays:
- 82.7 is the live upside liquidity target. The bullish path is not closed until lower levels fail
- 76.6 to 76.4 is the deciding zone. A 4H candle close below it changes the entire trade map toward 67,000
- 79.3 is a sweep zone first, a short trigger only after lower-timeframe confirmation
- Distribution and accumulation look identical inside a range. The break is what proves it
- ETH mirrors BTC. Wait for Bitcoin to show the direction, then follow
Fahad's closing message was straightforward: trade wisely, avoid gambling, and let the market prove itself before you commit. That discipline is what separates the traders who last from the ones who get shaken out.
If you want to be in the room when these levels are being called live, join the Hitpoint community for live market coverage and real-time trade alerts.
Watch the full stream: Bitcoin weekly support and resistance levels to watch on YouTube
Disclaimer: This article is for educational purposes only and is not investment advice. Crypto assets are unregulated in India, are highly volatile, and can lose value rapidly; there is no established investor-protection or grievance-redressal mechanism for them. Trading With Sidhant LLP is not a SEBI-registered Investment Adviser or Research Analyst, and nothing here constitutes a recommendation to buy or sell any asset. Income from virtual digital assets is taxable in India at 30% plus applicable cess, with 1% TDS on transfers. Past performance is not indicative of future results. Do your own research before trading.
Frequently Asked Questions
- What are the key Bitcoin weekly support and resistance levels right now?
- The three levels that define the current BTC map are **82.7** on the upside as the live liquidity target, **78.4** and **79.3** as local resistance and sweep zones in the middle, and **76.6 to 76.4** as the deciding weekly support. Above 76.6, the upside path toward 82.7 stays open. A confirmed 4H close below 76.4 shifts the map toward 67,000 to 68,000 on the downside.
- Why does 82.7 matter for Bitcoin liquidity this week?
- **82.7** is an untapped weekly liquidity level. Price has not swept the stops and orders sitting there yet, which gives the market a structural reason to push toward it. Fahad treated this as the primary upside draw, and the session's entire analysis was built around whether BTC confirms a reversal before reaching it or sweeps it first.
- What confirms a Bitcoin short below 76.6 instead of a random fade?
- Fahad required a 4H candle close below **76.4** as confirmation. A wick below the level does not count. The close has to be below it, meaning price sustained the break through an entire 4-hour period. Without that close, the level has only been tested, not broken, and shorting into a test without confirmation is the exact behavior he warned against.
- How should traders use the weekend high around 79.3 in BTC planning?
- The **79.3** weekend high should be treated as a liquidity sweep zone, not an automatic short trigger. Price often sweeps obvious highs to take out stops before reversing. Fahad's approach was to wait for that sweep, then look for a bearish pin bar or lower lows and lower highs on the 5-minute timeframe before entering. Shorting before the sweep is the common mistake.
- Is the current Bitcoin structure distribution or just a pause before another push higher?
- Honestly, the structure cannot be confirmed as distribution or accumulation while price is still inside the range. Fahad's money-flow indicator showed outflows on the weekly. Early warning, not a verdict. The only way to know is to watch where the range breaks and whether price sustains outside it.
Share this post

How to Use Direction Area Trigger in Nifty Trading
A Nifty short near 24,000 needed more than a pin bar: daily bias, a defined area and footprint evidence had to agree.
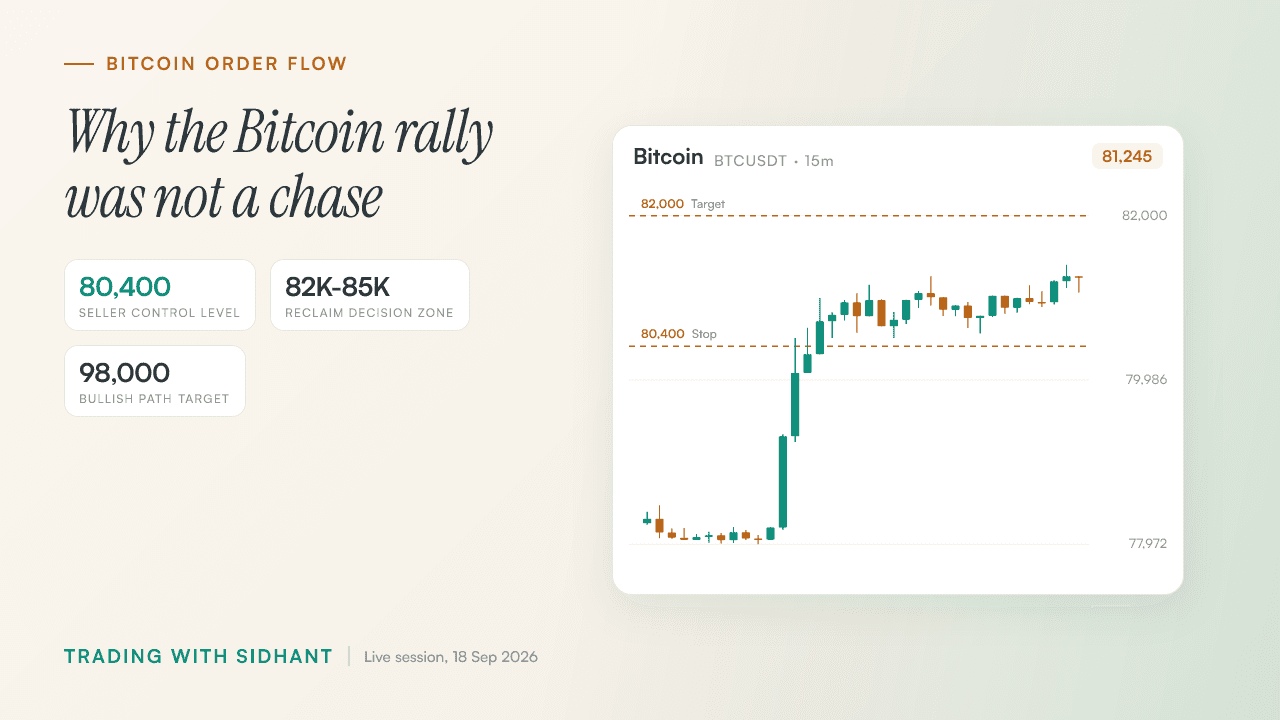
Bitcoin Order Flow Analysis After a Rally
Bitcoin had already rallied, so Fahad used 80,400, delta and seller exhaustion to explain why waiting beat a FOMO entry.

When to Quit a Profitable Intraday Strategy
Rs 12 lakh in profit looked different after Sidhant counted the 1,500 hours and the freedom the strategy had consumed.
Get post alerts in your inbox.
New blog post? We'll email you. No spam, unsubscribe anytime.
Join our Telegram community.
Get post alerts, trading discussions, and market updates.