Bitcoin open interest down while price rises meaning
Bitcoin pushed higher, but Fahad flagged one red flag fast: open interest was falling while price kept rising.
8 min read

Bitcoin was pumping. Everyone was watching the candles go up. But Fahad flagged something most people missed: bitcoin open interest down while price rises meaning the move looked thinner than it felt. Futures open interest was falling even as price pushed toward resistance. That divergence, price up, money flowing out, was the central warning of the entire session. We covered BTC levels from 76,198 all the way up to 83,000, worked through oil and gold setups, and kept coming back to one idea: the chart can look bullish while the data tells a completely different story.
Key Takeaways
- A level backed by real volume and liquidity holds. A random line on a chart does not.
- Spotting a resistance level and shorting into a live pump are two completely different decisions.
- Price rising while open interest falls signals short covering, not genuine buying, and that fuel runs out fast.
- Context first, opinion second: both oil and gold rewarded traders who waited for structure to confirm the idea.
- Accepting stops and skipping forced trades is the actual edge, not the indicator or the announcement.
76,198 worked because volume and liquidity made the level real
Our team spotted 76,198 as a valid bottom area because price respected the level precisely where volume and liquidity mattered most, showing that simple level quality often gives a cleaner read than forcing a trade after the move has already expanded. The market tapped that zone and turned. Clean, no drama.
Fahad's framing was direct: "Volume and liquidity, these two things are very important to understand." That is not a complex idea. It is the reason one level holds and another gets sliced through like it was never there.
The stream opened with Bitcoin already pumping. Immediate chart focus, no warm-up lap. Fahad went straight to the 1-hour timeframe and identified 76,198 as the area where the real bottom had formed. Price had tapped the level, respected it, and reversed. That tap-and-turn behavior is exactly what volume-backed levels produce.
As our breakdown of Bitcoin liquidity levels explains, not all price levels carry the same weight. The ones where large volume clustered previously tend to act as genuine magnets, not just lines on a chart.
Key Bitcoin levels our team referenced during the stream
| Level | Why it mattered |
|---|---|
| 76,198 | 1-hour bottom entry area; price tapped and reversed |
| 81,400 | Clearest shorting resistance on the stream |
| 81,468 | Nearby extension, closely clustered with 81,400 |
| 82,000 | First target reference above resistance |
| 82,799 | Secondary target / extension zone |
| 83,000 | Broader extension; invalidation risk if broken |
The whole point Fahad was making: a level earns its credibility from what happened there before, specifically volume and liquidity. 76,198 had both. That is why the market respected it exactly.

81,400 was the obvious short, but only if resistance confirmed
Our team treated 81,400 as the cleanest Bitcoin short area because resistance there could offer defined invalidation, but Fahad rejected random shorts into strength since extended price without confirmation usually traps traders who try to beat the top.
"The most obvious shorting opportunity. Now the market is pumping, why would I short into a pump?" That was Fahad's read, and it is the right one.
The nearby cluster of levels, 81,468, 82,000, 82,799, and 83,000, made the zone even more significant. Tight resistance clusters like that tend to produce two outcomes: a sharp rejection, or a squeeze through that flips everyone who shorted too early. Neither outcome rewards impatience.
"You can't beat the top." That line landed with conviction. Fahad framed it as a bull trap risk: price grinds toward resistance, weak shorts pile in early, and then the market pushes just far enough to stop them out before reversing. The traders who waited for actual confirmation at 81,400 had a real trade. Everyone else was gambling on timing.
For a deeper look at how our team approaches these short setups, our Bitcoin shorting strategy around local liquidity zones walks through the same logic in detail.
- No clean entry while price is in the middle of a push
- 81,400 only valid with resistance confirmation and clear invalidation
- Chasing above 83,000 without a pullback was explicitly rejected
- Bull trap framing: the pump itself is the warning, not the invitation

Rising price with falling open interest was the stream's biggest warning sign
Our team read rising Bitcoin price with falling open interest as a warning that positions were closing rather than fresh conviction entering, so the upside looked fragile and potentially trap-like even though the short-term move still appeared bullish on the chart.
This is the core of what "bitcoin open interest down while price rises meaning" actually looks like in practice.
Fahad called it plainly: "Open interest going down, that is a big negative signal." Then he simplified it further: "Money out, money going out." When open interest falls during a price rise, the most likely explanation is short covering, not new longs buying in. According to CoinDesk's analysis of the recent Bitcoin short squeeze, futures open interest collapsed to a five-month low precisely because short sellers were closing positions, not because fresh bullish capital was entering the market.
That distinction matters enormously. A rally built on short covering runs out of fuel the moment the shorts are gone. A rally built on new longs entering has buyers behind it.
The CVD (cumulative volume delta) was also below, and both net longs and net shorts were declining. The full picture was a market where participants were reducing exposure across the board, even while price moved up on the lower timeframe. Fahad described the conflict directly: "The market is not bullish on the big picture, but the short timeframe is bullish."
For traders who want to understand how order flow tools like CVD connect to this kind of analysis, mastering footprint trading and order flow covers the mechanics in full.
How our team interpreted Bitcoin's data during the pump
| Signal | What it suggested |
|---|---|
| Price rising | Short-term bullish momentum visible on chart |
| Open interest down | Positions closing, not new money entering |
| CVD below | Sell-side pressure present beneath the surface |
| Net longs down | Long holders reducing exposure |
| Net shorts down | Short covering driving the price move |
Put those five signals together and the picture is not a strong breakout. It is a short squeeze running out of road.
Oil and gold showed the same lesson: wait for structure, then size the risk
Our team saw the same discipline across oil and gold: oil offered only a risky scalp with short-term confirmation, while gold stayed structurally bullish above the prior high, proving that entries improve when market context and risk limits come before opinion.
On oil, Fahad was blunt about the quality: "I love the setup. I do it. Love, I just don't like it at all." The sarcasm was the signal. He would only enter the oil short after a 5-minute confirmation on the consolidation. If that confirmation did not appear, no trade. The whole thing was framed as a 1:1 risk-reward scalp at best, not a high-conviction trend trade.
Gold was a different story. Bullish structure on the 1-hour and 15-minute timeframes. Fahad's read: "As long as you are above the previous high, gold looks for a buy opportunity." The area around 4417 was flagged as a zone of interest, with the expectation that local highs could get swept before continuation higher. Fahad's gold market analysis from earlier sessions covers how this structural logic plays out across different timeframes.
- Oil: short only on 5-minute confirmation, 1:1 max, tight stop above invalidation
- Gold: long bias above prior high, 4417 area of interest, 15m and 1h structure intact
- Both setups required confirmation before entry, opinion was not enough

Basic trading beat hype, platform noise, and forced trades
Our team ended with a simple message: basic trading, clear levels, and strict risk control matter more than hype, broken tools, or influencer-style predictions, because traders keep capital by waiting for confirmation and accepting invalidation when a setup fails.
"Basic trading is where money is earned." Fahad said it without decoration. Master price action, mark levels, wait for confirmation. That sequence, repeated consistently, is what actually compounds.
Midstream, TradingView crashed while Fahad was trying to publish a custom indicator. "TradingView dumped. Why me?" The frustration was real and entirely human. But the session kept going. Tools fail. The process does not have to.
On accepting invalidation: "If it stops out, then that matter too, keep this in mind." A stopped-out trade is not a failure. A trader who ignores stops because they cannot accept being wrong is.
Fahad also called out the hype pattern directly. Streamers and traders who tease "something exciting is coming" and then deliver nothing are, in his words, just selling nonsense. The Hitpoint team does not run that playbook. Our accountability approach at Hitpoint Live is built on exactly the opposite: show the work, show the levels, show when it does not go as planned.
- Small position sizing on uncertain setups
- Strict stop placement, not flexible stops
- No forced trades when the level is not clean
- No hype announcements with nothing behind them

The stream came down to one honest read: price was moving up, but the data underneath it was thinning out. Here is what the session actually taught:
- 76,198 held because it was a real volume and liquidity level, not a guess
- 81,400 was the cleanest short zone, but only with resistance confirmation and defined invalidation
- Rising price plus falling open interest pointed to short covering, not fresh conviction entering the market
- Oil and gold both rewarded patience over opinion, confirmation before entry every time
- Basic trading, clear levels, strict risk control, these are what keep accounts alive through sessions where tools crash and setups fail
If this kind of live, data-driven analysis is what you want more of, join the Hitpoint community for live market coverage and real-time trade alerts. We work through these setups in real time, together.
Watch the full stream: Bitcoin open interest down while price rises meaning on YouTube
Disclaimer: This article is for educational purposes only and is not investment advice. Crypto assets are unregulated in India, are highly volatile, and can lose value rapidly; there is no established investor-protection or grievance-redressal mechanism for them. Trading With Sidhant LLP is not a SEBI-registered Investment Adviser or Research Analyst, and nothing here constitutes a recommendation to buy or sell any asset. Income from virtual digital assets is taxable in India at 30% plus applicable cess, with 1% TDS on transfers. Past performance is not indicative of future results. Do your own research before trading.
Frequently Asked Questions
- What does it mean when Bitcoin price rises but open interest falls?
- It means existing short positions are closing rather than new long positions opening, which is the signature of a short squeeze. The price move is driven by short sellers buying back to exit, not by fresh bullish capital entering. Once those shorts are fully covered, the upward fuel disappears. [CoinDesk's analysis of the recent squeeze](https://www.coindesk.com/markets/2026/08/25/a-bitcoin-short-squeeze-for-the-ages-as-futures-open-interest-collapses) confirmed futures open interest hit a five-month low during exactly this kind of move.
- Why did Fahad treat 81,400 as the clearest Bitcoin short area?
- **81,400** sat at a defined resistance cluster alongside **81,468**, **82,000**, and **82,799**, giving it a zone with clear invalidation logic. A short there has a specific level to prove itself against. Fahad's rule was simple: the level is only worth trading if resistance actually confirms at that point. Without confirmation, it is just a number on a chart.
- How do volume and liquidity help confirm a Bitcoin level?
- Volume shows where real participation happened previously, and liquidity shows where orders are likely clustered waiting to be filled. When both are present at a level, the market has a genuine reason to react there. **76,198** worked on the stream because it carried both. A level without volume behind it is just a line, and the market has no structural reason to respect it.
- Should traders short Bitcoin while price is pumping without resistance confirmation?
- No. Fahad was direct: "The most obvious shorting opportunity. Now the market is pumping, why would I short into a pump?" Shorting into momentum without a defined resistance level and clear invalidation point means you have no logical place to exit if wrong. The pump itself can extend far enough to stop out early shorts before reversing, which is the bull trap pattern the stream specifically warned against.
Share this post

How to Use Direction Area Trigger in Nifty Trading
A Nifty short near 24,000 needed more than a pin bar: daily bias, a defined area and footprint evidence had to agree.
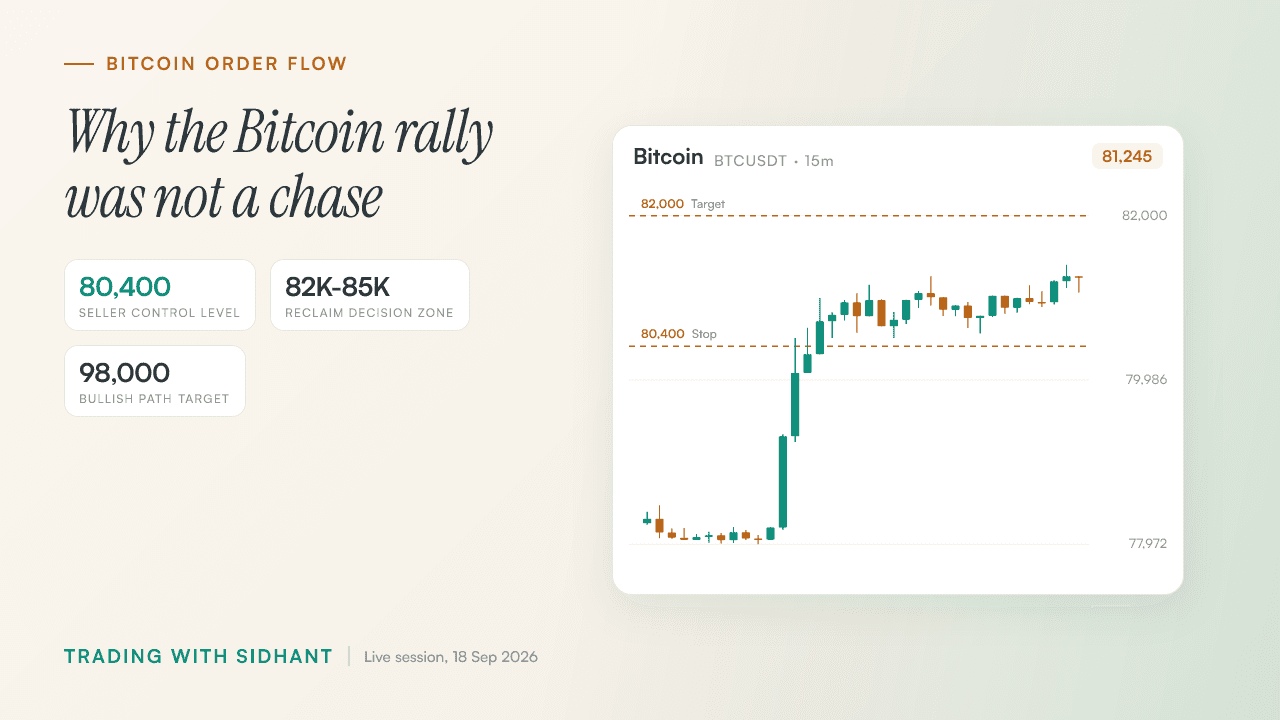
Bitcoin Order Flow Analysis After a Rally
Bitcoin had already rallied, so Fahad used 80,400, delta and seller exhaustion to explain why waiting beat a FOMO entry.

When to Quit a Profitable Intraday Strategy
Rs 12 lakh in profit looked different after Sidhant counted the 1,500 hours and the freedom the strategy had consumed.
Get post alerts in your inbox.
New blog post? We'll email you. No spam, unsubscribe anytime.
Join our Telegram community.
Get post alerts, trading discussions, and market updates.