Bitcoin order flow trading strategy: Wait for confluence
Bitcoin reversed sharply, but Fahad stayed neutral below 84,000 and waited for a pullback instead of chasing trapped sellers.
8 min read
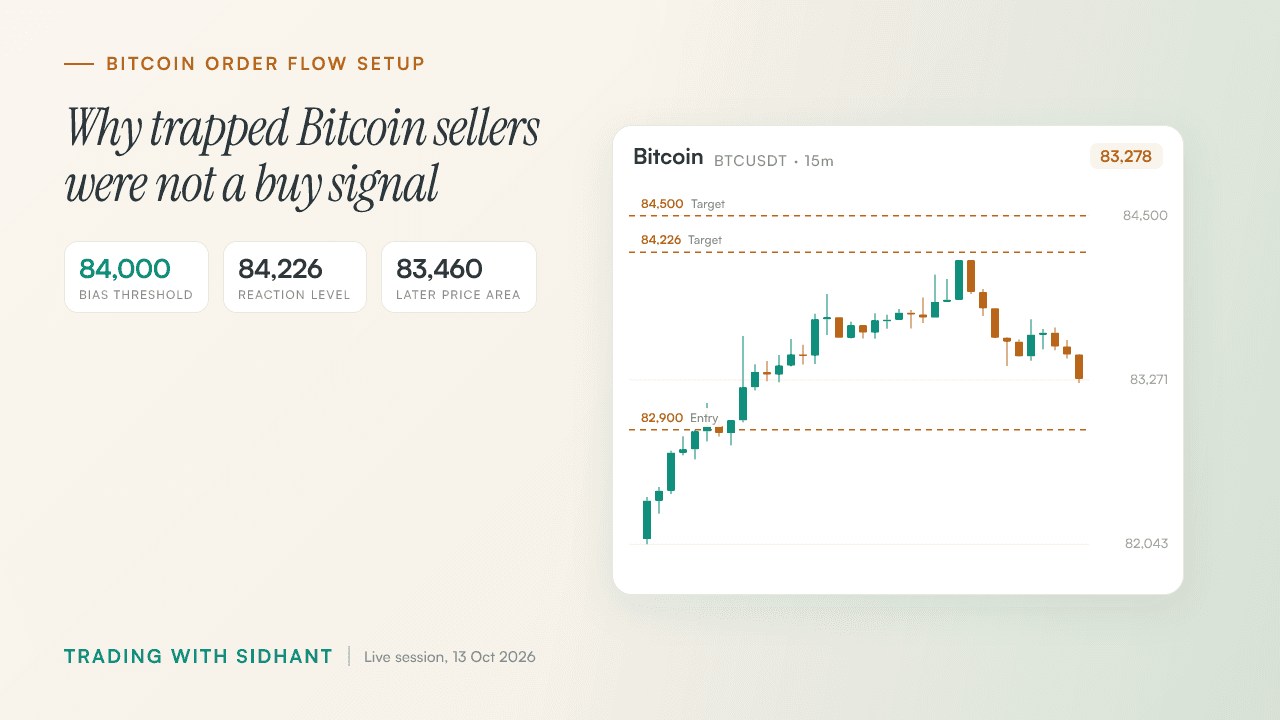
Bitcoin reversed after sweeping Friday's poor low. Fahad did not chase it. 'As crazy as yesterday's dump was, today's reversal is just as crazy,' he said on the stream, but he stayed neutral below 84,000. Our bitcoin order flow trading strategy read started with sellers hitting the low and buyers stepping in. It still needed an entry area. We marked the two pullbacks Fahad discussed without assigning either a price. He also managed a gold short from $4,193 and closed an oil short at breakeven.
Key Takeaways
- The sweep explained the bounce, but Fahad stayed neutral while Bitcoin remained below **84,000**.
- Absorption gave us a reason to investigate the reversal, not a reason to enter late.
- Fahad separated his two entry areas from the upside references and gave no exact price for either planned pullback.
- Fahad managed the gold scalp after its first profit and left oil at breakeven when consolidation weakened the short case.
- Waiting on Bitcoin and exiting oil at breakeven both kept risk under control when the evidence did not support pressing a trade.
Bitcoin stayed neutral below 84,000 after two sweeps
Monday swept the weekend price action, and Tuesday took out Friday's poor low before Bitcoin reversed. Fahad kept his bias neutral below 84,000. He marked 84,226 as a possible reaction level, not a breakout call. Bitcoin later stalled near 83,460, leaving us with a strong bounce but no settled direction.
The old levels gave the reversal context. On the previous stream, Fahad had marked the weekend high, weekend low and Friday liquidity area. Price reacted near the lower liquidity curve he had identified. We could check the bounce against those references instead of judging it by candle size alone.
- Weekend high and low: Monday's candle swept the weekend price action.
- Friday liquidity or week low: Tuesday took out Friday's poor low before reversing.
- 84,000 and 84,226: Fahad remained neutral below 84,000 and marked 84,226 for a possible reaction. Price later sat near 83,460.
A sweep shows where price took liquidity. It does not tell us whether the next move will continue, which is why we kept the Bitcoin support and resistance levels in view as the bounce slowed. For a closer look at checking a sweep against what follows, see Bitcoin liquidity sweeps with confirmation.
Footprint absorption and rising open interest did not justify chasing
We spotted heavy selling at Bitcoin's low while buyers stepped in at the same area. Fahad read that as a possible sign of trapped sellers. Rising open interest and a run of zero red candles on the 30-minute chart supported the push higher. None of it gave us a planned entry after the pump.
The footprint showed a reason to look closer. Fahad pointed to selling bubbles of 3 million, 2 million and 2 million, then to buyers appearing at the low. He called out 'a green dot inside the red dot.' Aggressive sellers had hit the price, yet buyers were there too.
- Footprint example: At 83,300, Fahad showed 75,000 buying against 164,000 selling.
- Open interest: It rose during the upward push as positions opened while shorts closed or were liquidated. That reading alone could not set an entry.
- Our decision: We waited for one of Fahad's planned areas rather than buying because the footprint looked striking.
A Bitcoin footprint chart displays buying and selling volume at individual prices. Order flow covers more than that one display, and the order-flow approach to trading strategies looks at buying and selling activity behind price changes. Our Bitcoin open interest and CVD range analysis addresses the separate question of positioning as price moves. Fahad's rule was blunt: 'If I see the data, I take the trades; if there is no data, I don't take the trade.'
Two pullback areas mattered before the 84,226 reaction level
Fahad outlined two conditional Bitcoin long areas: a VWAP, Golden Pocket and Point of Control confluence and a separate sudden-volume-gap area. He gave neither an exact entry price. Local highs came first in his plan. 84,226 was a possible reaction level, while 84,500 to 85,100 marked an upside imbalance if price continued higher.
A pullback still had to prove itself. The confluence gave Fahad several chart references in one area. The volume gap was a different setup, with a stated risk that a bounce might fail at the range highs. Neither was a reason to buy immediately after the pump.
Bitcoin's conditional entry areas and upside references
| Area or level | What Fahad observed | Trading implication |
|---|---|---|
| VWAP, Golden Pocket and Point of Control | The references met; no exact entry price was stated. | First conditional long area if price returned and the setup held up. |
| Sudden-volume-gap area | A separate pullback area with no stated entry price. | Another conditional long, though price might fail at the range highs. |
| 84,226 | A marked possible reaction level near the local highs. | Assess the reaction rather than assume a breakout. |
| 84,500 to 85,100 | An upside imbalance, with a poor high or liquidity area above. | A further reference if price continued higher. |
A viewer's entry near 82,900 was separate from Fahad's two areas. Fahad described that entry as good, and the viewer's 84,200 upside reference was separate from his plan too. On the Bitcoin chart below, the 82,900 label refers to the viewer's entry, not a price Fahad assigned to either pullback.
We took the same area-first approach in our Bitcoin VWAP reclaim analysis: mark where a trade might make sense, then judge what price does when it gets there.
◆ Interactive Lab
Open in new tab ↗Drive the order book yourself
Gold hit $4,186 while oil closed at breakeven
Fahad shorted gold at $4,193 after rejection near a high-volume node and took first profit at $4,186. He moved the stop to breakeven, then trailed it to a $4,189 reference. Oil kept consolidating in the range's premium area, weakening his short case. He confirmed an exit at breakeven.
The trades needed different responses. Gold also had a volume-gap area and the previous day's volume-area high in view, so Fahad treated the short as a quick scalp. He remained broadly bearish on oil but saw room for a local bounce. Silver's mixed signals gave us no clear trade.
Gold, oil and silver decisions from the stream
| Instrument | Decision | Stated levels or outcome | Reason |
|---|---|---|---|
| Gold | Short scalp; first profit taken; stop trailed. | Entry $4,193; first profit $4,186; later stop reference $4,189. | Rejection near a high-volume node, a volume-gap area and the previous-day volume-area high. |
| Oil | Short exited at breakeven. | No exact entry or initial stop price stated. | Continued premium-area consolidation raised the risk of an upside break. |
| Silver | No clear trade presented. | No entry stated. | 15-minute and 30-minute views gave mixed signals. |
Fahad had initially said it was too soon to short oil. Once in the trade, he watched price continue to range in the premium area and chose not to hold the short through that change in risk. Our gold market conditions analysis discusses why the setting around an entry matters. The gold chart below marks the three prices he stated on the stream.
◆ Interactive Lab
Open in new tab ↗Drive the order book yourself
Capital protection mattered more than a perfect win rate
Fahad said a 50% to 60% win rate can work when losses are controlled. The percentage alone guarantees nothing. Bitcoin was sideways, and we saw little reason to force another position in the quiet crypto market. On this stream, protecting the account meant waiting for data and changing an exit when the trade case weakened.
The decisions made the risk lesson concrete.
- Wait through the stall: Bitcoin sat near 83,460. Fahad asked, 'How and why would anyone want to trade this?'
- Manage the exit: He moved gold's stop to breakeven before trailing it. He closed oil at breakeven when its premium-area consolidation persisted.
- Check the payoff: Fahad did not find a 1:1 scalp compelling when price could reverse. A high hit rate would not make oversized losses harmless.
We can have a sound market read without having a trade worth taking. Trading exit strategies deserve attention alongside entries. The oil chart below marks the prior session's high and low as references, but Fahad gave no exact oil entry or initial stop price on the stream.
His closing warning needed no polish: 'Do not blow your account. Follow risk management. Don't FOMO. Don't gamble.'
◆ Interactive Lab
Open in new tab ↗Drive the order book yourself
Bitcoin's reversal got our attention, but its speed could not give us an entry. We had selling at the low, buyers stepping in and rising open interest to examine. Fahad still wanted price back at one of his planned areas. Gold gave him a scalp he could manage after the first profit; oil gave him a reason to leave at breakeven when the short case weakened. We did not need to make those decisions look alike. The useful habit from this stream was to keep checking the trade against the data after the first read, especially when price stops cooperating. Join the Hitpoint community for live market coverage and real-time trade alerts.
Watch the full stream: Bitcoin order flow trading strategy: Wait for confluence on YouTube
Disclaimer: This article is for educational purposes only and is not investment advice. The price levels, setups and trades described are a review of market events that have already occurred, shared to illustrate a method of analysis rather than to recommend any trade. Trading With Sidhant LLP is not a SEBI-registered Investment Adviser or Research Analyst, and nothing here constitutes a recommendation to buy or sell any security. Investments in securities markets are subject to market risks; read all the related documents carefully before investing. Past performance is not indicative of future results. Please consult a SEBI-registered financial adviser before acting on any information in this article.
Frequently Asked Questions
- Why did Fahad stay neutral on Bitcoin below 84,000?
- Fahad stayed neutral because Bitcoin had not moved above his **84,000** bias threshold. Monday swept the weekend price action, and Tuesday took Friday's poor low before reversing. We marked **84,226** as a possible reaction level, but price later stalled near **83,460**. The bounce was sharp without settling the directional case.
- How can a footprint chart show sellers being absorbed at a Bitcoin low?
- A footprint chart shows buying and selling volume at individual prices, so we can compare aggressive selling with buyers appearing at the same low. Fahad showed selling bubbles of **3 million**, **2 million** and **2 million**, then pointed to a green buying dot inside a red selling dot. His **83,300** teaching example showed **75,000** buying against **164,000** selling. That reading was not an automatic entry.
- Where were the two conditional Bitcoin long areas?
- Fahad's first conditional area was the **VWAP, Golden Pocket and Point of Control** confluence. The second was a separate sudden-volume-gap area. He gave no exact entry price for either. Local highs and **84,226** were upside references, while **84,500 to 85,100** marked a further imbalance. A viewer's entry near **82,900** was separate from Fahad's planned areas.
- What happened to the gold short and oil short?
- Fahad shorted gold at **$4,193** and took first profit at **$4,186**. He moved its stop to breakeven before trailing it to a **$4,189** reference. He exited the oil short at breakeven after continued consolidation in the premium area raised the risk of an upside break. He stated no exact oil entry or initial stop price.
- Can a trading strategy work with a 50% to 60% win rate?
- A **50% to 60%** win rate can be workable when gains and losses are managed well, but the percentage alone does not establish profitability. Fahad warned that large losses can erase a run of wins. On the stream, he managed gold's stop after taking first profit and closed oil at breakeven rather than holding the short while its case weakened.
Share this post
How to Read Bitcoin Open Interest and CVD Before 87,000
Rising CVD supported Fahad's Bitcoin upside bias, but a later drop in open interest changed what the buying meant.
How to Trade Bitcoin Liquidity Sweeps Near 81,900
Bitcoin swept both sides of its range, but Fahad wanted an 81,900 reclaim to buy or a confirmed VWAP loss to short.
Bitcoin Liquidity Sweep Trading Strategy: TP1 and Stops
A Bitcoin short reached TP1, but the bigger lesson came from the trailing stop that ended the trade.
Get post alerts in your inbox.
New blog post? We'll email you. No spam, unsubscribe anytime.
Join our Telegram community.
Get post alerts, trading discussions, and market updates.