How to Read Bitcoin Open Interest and CVD in a Range
Bitcoin's 84,800 failure led to an almost 3.5% move, but rising open interest gave Fahad no confirmed direction in the new range.
8 min read
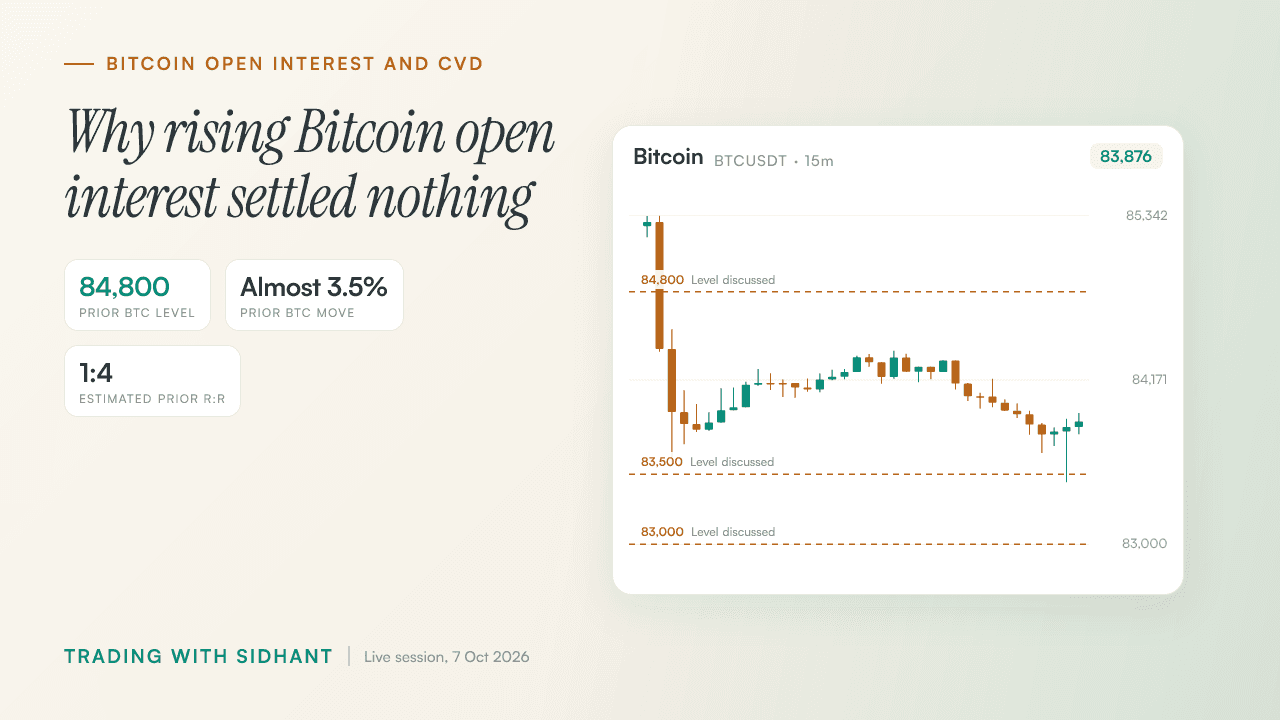
Bitcoin lost 84,800, then moved almost 3.5% lower. Fahad had flagged the level before it failed, and an exit at his marked area would have offered roughly 1:4 risk-to-reward. On the stream, though, he would not carry that bearish view into Bitcoin's new range. The question of how to read bitcoin open interest and CVD mattered more than the last winning idea. Positions were building on both sides. Fahad called it 'fuel for both sides,' but neither side had given way.
Key Takeaways
- A prior short can be right without giving the next range a bearish direction.
- Rising participation tells us positions are building; price response tells us whether that pressure is gaining ground.
- VWAP marked a decision area, but Fahad required price to prove the reclaim or rejection.
- Oil reached its first target after confirmation; gold ended at break-even instead of rewarding an early entry.
- A slower chart and a smaller risk goal leave more room to learn what the data actually says.
Bitcoin's 84,800 failure worked, but the next range had no fixed direction
Prior breakdown, current range. Fahad marked 84,800 as a Bitcoin level that needed to hold. After it failed, price moved almost 3.5% lower, and his marked exit offered roughly 1:4 risk-to-reward. On the stream, we found Bitcoin ranging instead. Fahad gave the new range no fixed direction.
The earlier short did not answer what to do next. Fahad recalled that wicks had stopped him out of three of 11 trades before price moved as he had anticipated. A sound read had not kept every entry alive.
- 84,800: The prior level that failed.
- Almost 3.5%: The move Fahad described after that failure.
- Current range: Bitcoin swept local liquidity and filled a nearby single-print imbalance, but neither event settled direction.
The Bitcoin chart below marks 84,800 and a viewer-mentioned 83,000 to 83,500 area. That viewer's area was not a confirmed entry from Fahad. Our Bitcoin liquidity sweep and confirmation guide explains why we wait for evidence beyond a sweep.
◆ Interactive Lab
Open in new tab ↗Drive the order book yourself
Rising Bitcoin open interest left fuel for longs and shorts
We saw open interest rise as long and short positions built during Bitcoin's volatile range. Fahad read that as fresh positioning, not a win for either side. He checked CVD and net positions for absorption or divergence. The early absorption reading was too small for him to call a reversal.
More positions did not mean more certainty. Open interest measures outstanding derivatives positions. An increase shows that positions are building, but it does not tell us which side will win. Our Bitcoin open interest and price guide goes further on that distinction. An open-interest market report offers another look at positioning.
Fahad's phrase was 'fuel for both sides.' Neither group had clearly exited or been liquidated, so we kept watching price rather than awarding buyers or sellers the range.
Our data check followed the panels Fahad watched:
- Open price and open interest: Was price moving as outstanding positions grew, or as positions closed?
- CVD: Was aggressive buying or selling showing up, and did price respond? CVD tracks the running difference between the two. See order-flow research on delta and absorption for more on that price response.
- Net longs and net shorts: Which side was adding positions, and was either side giving way?
Across recent 5, 10, 20 and 25-minute intervals, Fahad saw open interest and CVD rise together. Price showed a small absorption signal. 'Not yet, not yet,' he said: we could see pressure meeting resistance, but not enough to call a reversal. We take the same care with negative delta and rising open interest: the data needs a price response.
A VWAP reclaim or rejection could resolve Bitcoin's range
Fahad kept both Bitcoin ideas conditional. A long required VWAP to curve upward, followed by a convincing reclaim and retest. A slow grind until VWAP caught up did not qualify. A rejection near VWAP, the weekend lows or the single print could support a short toward range lows, but neither trade was confirmed.
A touch was not a trigger. We had seen liquidity swept and the single print filled, yet Fahad still gave the range no fixed direction. How price reached a level, then responded, mattered more than the touch itself. Our VWAP reclaim without chasing discussion follows that distinction.
Fahad's conditional Bitcoin range setups
| Scenario | Required confirmation | Proposed direction | What remains unknown |
|---|---|---|---|
| VWAP reclaim | VWAP curves upward, then price convincingly reclaims and retests it | Possible long | No exact entry, target price or stop was stated |
| Overhead rejection | Price rejects near VWAP, the weekend lows or the single print | Possible short toward range lows | No exact entry, target price or stop was stated |
| Range continues | Neither reclaim nor rejection confirms | No fixed direction | Which side gains control |
A slow climb into a flat VWAP might resemble a reclaim on a screenshot. Fahad rejected it because VWAP catching up to price was not the move he wanted. The short faced the same test: nearby references marked an area to assess, not a confirmed rejection. Neither live Bitcoin setup had triggered. Our Bitcoin range trading with small risk piece covers the cost of mistaking an area for an entry.
Oil reached its first target while gold ended at break-even
Our team saw Fahad wait for candle-close confirmation rather than shorting a wick or guessing a breakout. Oil closed below its decision area, triggering a short that reached its first target. Fahad moved the stop to break-even. Gold's planned scalp also required a strong close below the previous candle; that trade later stopped at break-even.
Same patience, different outcomes. Oil's marked area worked both ways: a reclaim allowed for a possible long, while a strong rejection allowed for a short. Fahad saw a bullish flag on a smaller timeframe but also noted money flow leaving. Once the relevant candle closed below the area, he took the short.
Confirmed oil and gold setups on the stream
| Market | Confirmation required | Observed outcome | Risk lesson |
|---|---|---|---|
| Oil | Close below the relevant candle for a short; reclaim of the area was the alternative long condition | Short reached its first target; stop moved to break-even | No exact entry, target or stop prices were stated |
| Gold | Strong close below the previous candle on the 5-minute chart, not a wick beneath it | Planned scalp stopped at break-even | An immediate short had a large stop relative to its nearby target; no exact trade prices were stated |
Later, Fahad flagged a possible short squeeze in oil and described roughly half of that move as covered. Reaching the first target had not removed the need to manage the position.
Gold made the entry lesson sharper. Fahad had also mapped two 15-minute day-trade areas using the volume-area low and confluence around the golden pocket, point of control and 0.786 Fibonacci level. He gave no exact prices for those setups. The gold chart below does not mark an exact trade entry or stop. Our trading confirmation guide covers why the candle close mattered.
◆ Interactive Lab
Open in new tab ↗Drive the order book yourself
Beginners should use slower charts and protect capital first
Fahad warned beginners against copying his 1-minute and 5-minute stream trades because smaller charts carry more noise. For day trades, he suggested 30-minute analysis with 15-minute entries, or waiting for 30-minute confirmation. We used order flow to support price action, not replace it, and put capital preservation first.
The fast chart was Fahad's tool, not his beginner lesson. He was direct about how easily a newer trader could lose money in small-timeframe noise. We took three practical points from his explanation:
- Timeframe: Start with the 30-minute view; use 15-minute entries or wait for 30-minute confirmation.
- Risk-to-reward: Get consistent with 1:2 before pursuing 1:4 or 1:6. Fahad said 1:3 can be enough, and a larger ratio will not appear on every trade.
- Capital: Build roughly six months of consistency before thinking about scaling. Save capital first.
Fahad also distinguished a footprint chart from order flow. Footprint shows buying and selling at individual prices. Order flow covers more data, including order books, depth of market and liquidation maps. One absorption reading cannot replace price structure; our footprint delta and false signals guide takes up that problem.
He closed with a plain instruction: 'Do not take random trades in any way. Save your capital, that is the first thing.'
The moment that stayed with our team was Fahad declining to turn rising open interest into a Bitcoin direction. The earlier 84,800 short had worked, but the new range still held positions on both sides. A small absorption reading did not change his mind, and neither VWAP path earned an entry on the stream. Oil reached its first target while gold finished at break-even, outcomes that gave us more to work with than a prediction would have. We left with Fahad's closing priority in mind: save capital before looking for the next trade. Join the Hitpoint community for live market coverage and real-time trade alerts.
Watch the full stream: How to Read Bitcoin Open Interest and CVD in a Range on YouTube
Disclaimer: This article is for educational purposes only and is not investment advice. The price levels, setups and trades described are a review of market events that have already occurred, shared to illustrate a method of analysis rather than to recommend any trade. Trading With Sidhant LLP is not a SEBI-registered Investment Adviser or Research Analyst, and nothing here constitutes a recommendation to buy or sell any security. Investments in securities markets are subject to market risks; read all the related documents carefully before investing. Past performance is not indicative of future results. Please consult a SEBI-registered financial adviser before acting on any information in this article.
Frequently Asked Questions
- What does rising open interest mean when Bitcoin stays in a range?
- It means outstanding positions are growing, not that the range has picked a direction. On the stream, Fahad saw longs and shorts build while Bitcoin remained undecided. He called it 'fuel for both sides' because neither group had clearly exited or been forced out. We needed price response and positioning evidence before treating the increase as a directional signal.
- How can CVD help identify absorption in Bitcoin?
- CVD can help identify absorption when aggressive buying rises but price fails to advance in step with it, or when aggressive selling meets a similarly stubborn price response. Fahad watched CVD alongside open interest and net positions on the stream. He saw a small absorption reading but would not call a reversal because its scale was insufficient.
- When would a VWAP reclaim support a Bitcoin long?
- Fahad's conditional long required VWAP to curve upward, followed by a convincing price reclaim and retest. A slow grind while VWAP merely caught up to price did not meet his standard. During the stream, that bullish path remained an idea, not a confirmed trade. Fahad gave no exact long entry or stop.
- Why was the live Bitcoin short still unconfirmed?
- Bitcoin had not given Fahad a confirmed rejection near the references he was watching: VWAP, the weekend lows and the nearby single print. He described a possible move toward range lows if rejection appeared, but positions remained on both sides. The prior **84,800** breakdown did not confirm a fresh short inside the new range.
- Is a footprint chart the same as order flow?
- No. A footprint chart displays buying and selling at individual prices; order flow covers the wider set of data Fahad discussed, including order books, depth of market and liquidation maps. He warned against treating one absorption reading as a complete trading decision. We still needed price action and market structure to judge whether it mattered.
Share this post
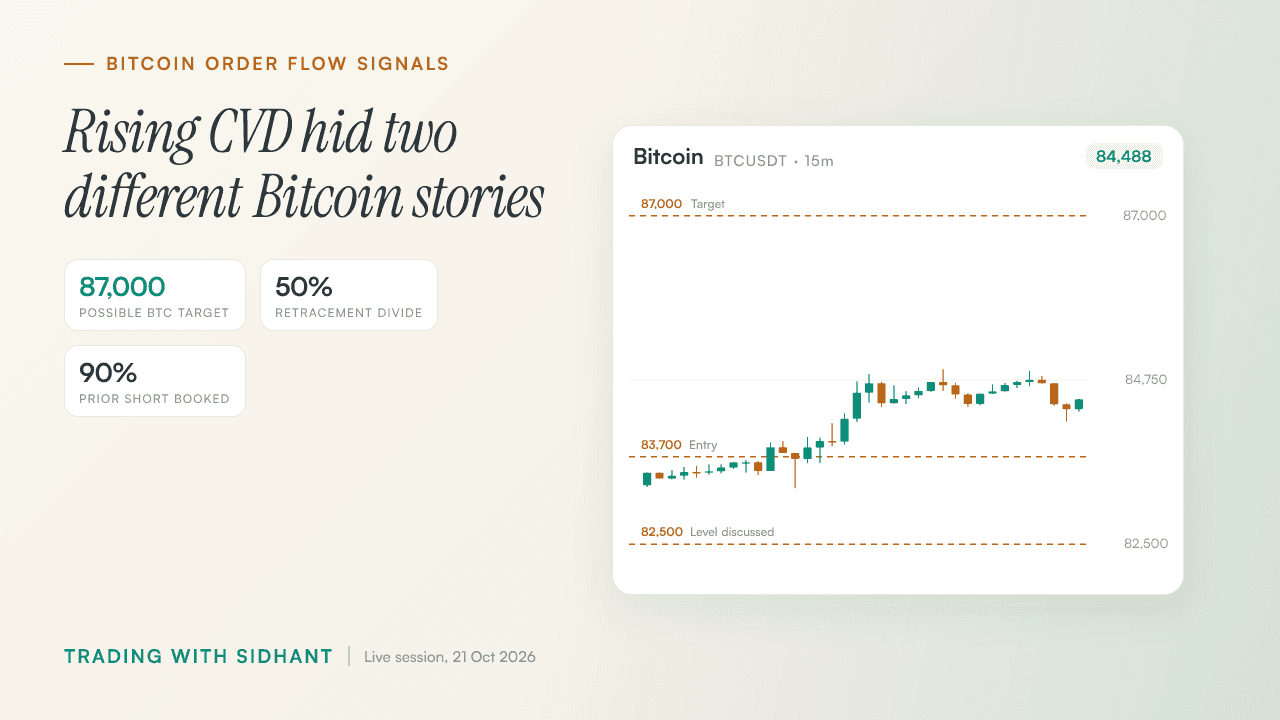
How to Read Bitcoin Open Interest and CVD Before 87,000
Rising CVD supported Fahad's Bitcoin upside bias, but a later drop in open interest changed what the buying meant.
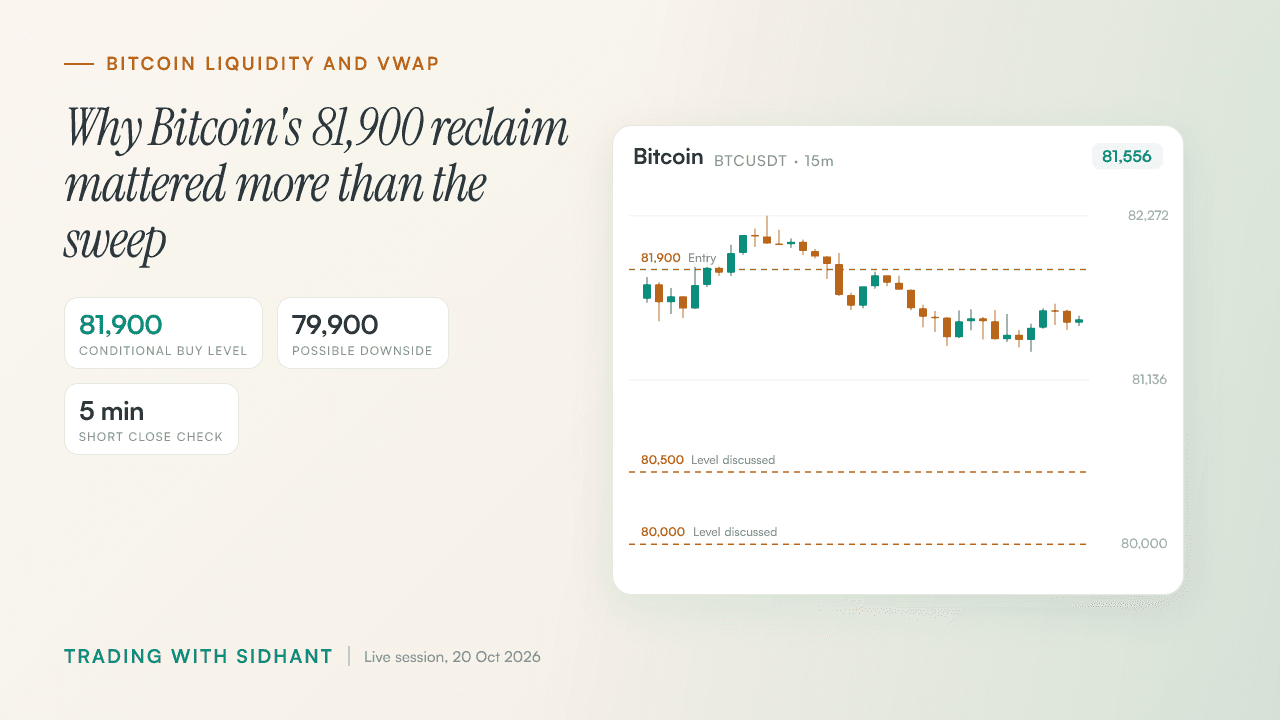
How to Trade Bitcoin Liquidity Sweeps Near 81,900
Bitcoin swept both sides of its range, but Fahad wanted an 81,900 reclaim to buy or a confirmed VWAP loss to short.
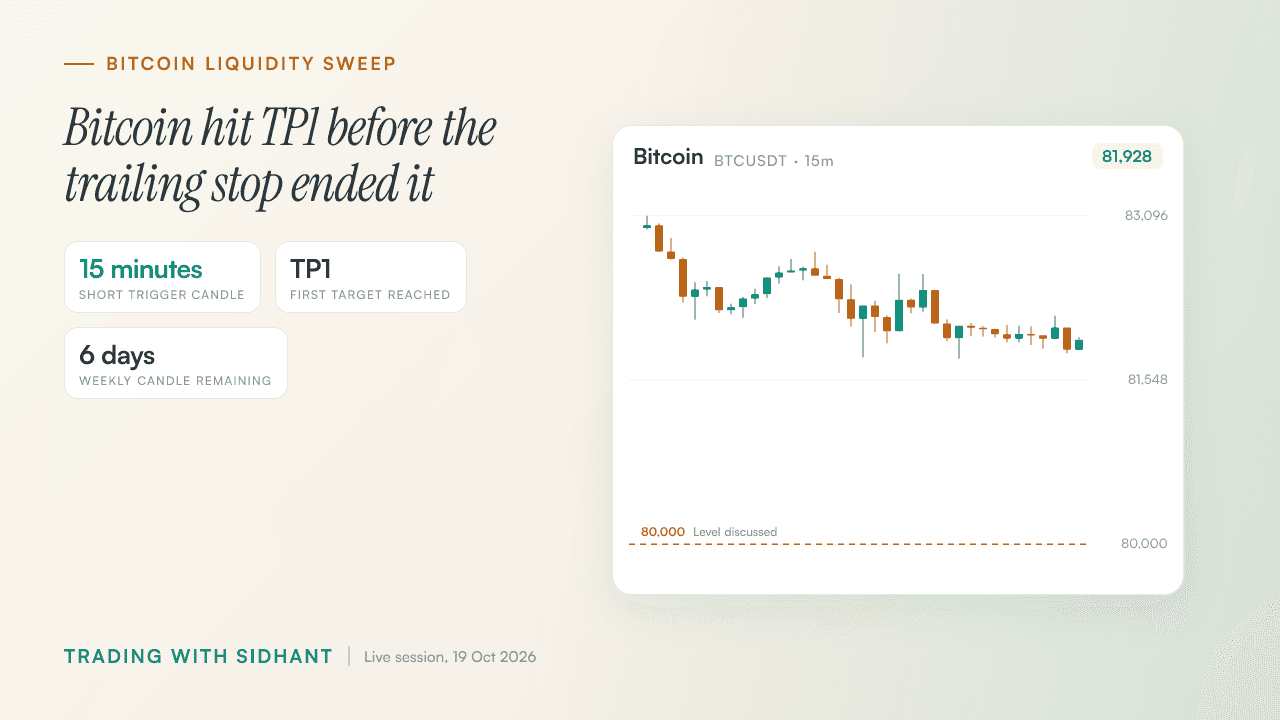
Bitcoin Liquidity Sweep Trading Strategy: TP1 and Stops
A Bitcoin short reached TP1, but the bigger lesson came from the trailing stop that ended the trade.
Get post alerts in your inbox.
New blog post? We'll email you. No spam, unsubscribe anytime.
Join our Telegram community.
Get post alerts, trading discussions, and market updates.