How to Read Bitcoin Order Flow Before a Short
Bitcoin buyers stepped in near 82,434, but falling open interest and CVD made a bounce harder to trust.
6 min read
Three million in buying, and Bitcoin still fell. Fahad called it buyers getting trapped. That example set up the question for our team: how to read bitcoin order flow before a short when a large buying print points one way and price goes the other.
On the stream, we compared orders hitting the market with liquidity resting in the book, then checked what price did afterward. Near 82,434, Fahad wanted confirmation before considering a buy. The number on the footprint was never enough by itself.
Key Takeaways
- A falling price and falling open interest can describe exits, so Fahad waited for the VWAP reaction before trusting the bearish setup.
- A buying bubble shows who crossed the spread, not whether those buyers moved price in their favor.
- Compare aggressive delta with resting liquidity, then let price confirm whether the level actually gave way.
- Fahad kept each scenario conditional: a VWAP rejection favored shorts, while a reclaim or confirmed support bounce changed the read.
Bitcoin swept weekend highs while open interest and CVD fell
Bitcoin swept the weekend highs after a pumping weekend, then reversed as open interest and CVD moved lower. Fahad kept a bearish bias, but he did not read the decline as proof that fresh shorts had driven it. We looked for a VWAP rejection before treating the move as a short setup.
Falling price did not prove fresh selling. The weekend low was also taken out during the stream. On the BTC 5-minute chart, the sweeps at both ends gave us more reason to wait for a reaction than to short the latest red candle.
- Open interest fell: Fewer positions remained open, which fit Fahad's view that traders were closing exposure.
- CVD fell: Aggressive selling outweighed aggressive buying over the period he examined. That reading did not show whether those sellers opened new positions.
- VWAP was the test: Fahad wanted a rejection there for his short idea. A reclaim would cancel it.
Our Bitcoin open interest and CVD range breakdown covers why we read those measures alongside price. Here, the weekend sweeps supplied that context. VWAP is a volume-weighted price benchmark, but its value to this plan depended on how Bitcoin reacted when it reached the area.
Three million in buying could still leave Bitcoin buyers trapped
Fahad showed three million in buying while the market still dumped. That made the buyers' size a poor argument for a bounce. We checked where price went after the buying, then read CVD and open interest alongside it. A large volume bubble alone could not tell us whether traders were entering or exiting.
The buying was large. Price still fell. Fahad also explained that one million in buying could accompany either a pump or a dump. The bubble showed activity, not whether aggressive buyers had found enough resting sell orders to stop their advance.
We used three checks before calling a buying print bullish:
- Price response: Did buying lift BTC, or did price fall despite it?
- CVD: What did the broader aggressive flow show alongside the print?
- Open interest: Were positions expanding or closing as price moved?
On Fahad's footprint, sellers appeared on the left and buyers on the right. We could see which side traded aggressively at a price, but the larger print did not tell us who won. Our footprint delta guide deals with that reading error in more detail.
In this Bitcoin trapped buyers example, heavy buying arrived and price dumped. We did not need to assign an identity or an entry price to every buyer. The failed price response was enough to challenge the claim that the print marked a bottom.
Delta must challenge resting sell orders before resistance breaks
Limit sell orders rest at resistance, and aggressive market buys trade into them. Fahad compared 200 units of resting sell liquidity with 751 units of delta to show how buying could pressure a level that appeared to hold. Those figures were illustrative. We still needed price to confirm whether resistance broke.
Fahad put the distinction bluntly: 'The only job of limit orders is to fill the book. They can't move the market.' In his simplified ladder, price was at 99, with sell orders at 100 and 101 and buy orders at 98 and 97. A market buyer traded into the offers above price; a resting order waited to be reached.
Illustrative order flow at resistance, not a recorded BTC trade
| Book component | Example quantity | What to check |
|---|---|---|
| Resting sell liquidity at resistance | 200 units | How much buying meets the offers? |
| Aggressive delta | 751 units | How does buying pressure compare with those offers? |
| Price response | No breakout result stated | Did price move beyond resistance, or fail there? |
The comparison gave us a way to examine pressure, not a breakout signal on its own. Buyers could keep trading into a level that still appeared to hold. We would watch whether price got through before deciding the offers had been consumed. Our Bitcoin resistance and order-flow breakdown uses the same price-response test.
VWAP and 84,200 set the conditions for a Bitcoin bias change
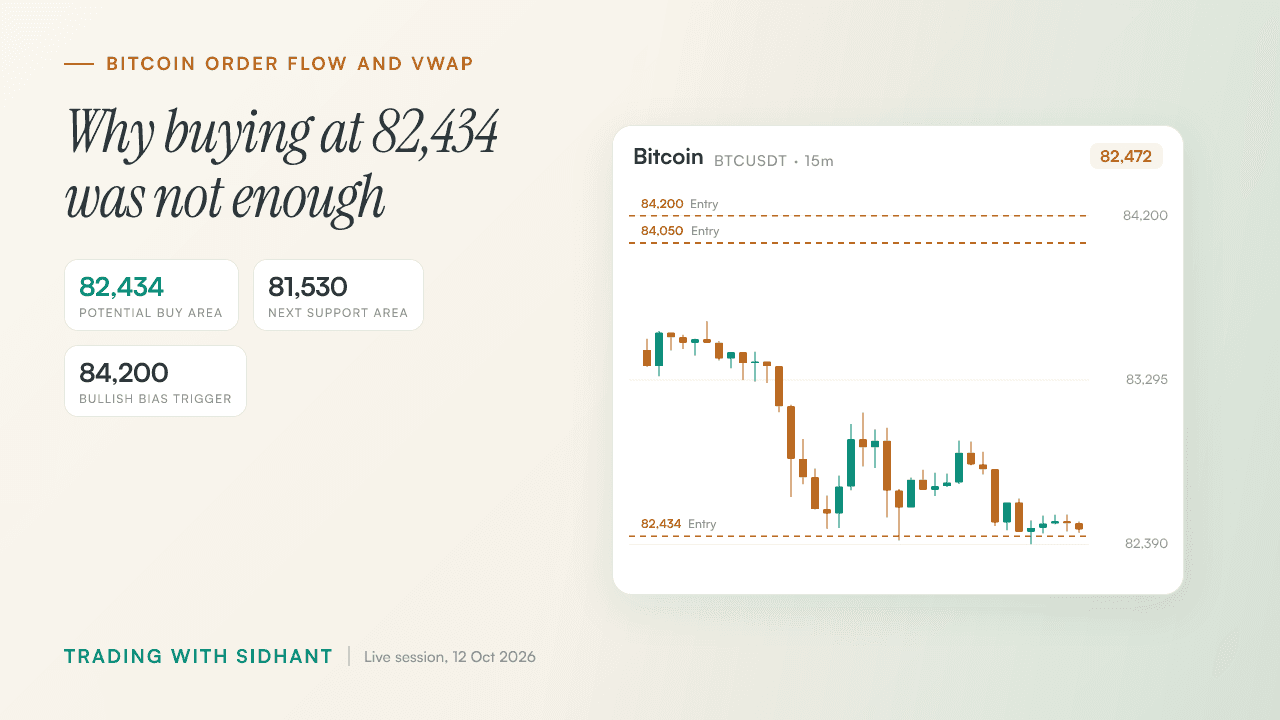
Fahad favored a BTC short on a VWAP rejection. Below VWAP, his bias was bearish; between VWAP and the local high, neutral. Above 84,200, he would consider a bullish bias. A buy near 82,434 needed a strong bullish engulfing candle or pin bar, while failure around 82,400 brought 81,530 into view.
'I want to remove the buy button from my exchange for today,' he told chat. We heard a strong bearish preference, but his short plan still required a VWAP rejection. Our Bitcoin VWAP reclaim breakdown covers the other side of that decision. We kept the linked trading clip separate from Fahad's stated condition: Bitcoin had to show its reaction at VWAP.
Bitcoin levels and conditional plans discussed on the stream
| Level or condition | Interpretation | Required confirmation |
|---|---|---|
| VWAP rejection | Fahad's preferred short scenario | Price rejects VWAP rather than reclaiming it |
| 82,434 | Potential buy area | Strong bullish engulfing candle or pin bar |
| Below 82,400 | Next major support or liquidity area near 81,530 | The support area fails |
| Above 84,200 | Possible bullish bias change | Price clears the local high |
| 84,050 to 82,000 | Viewer's discussed short entry and target | Previous high was the stop reference |
The chart below marks the discussed levels on 15-minute BTC candles, not a trade executed by our team. Fahad asked viewers to plan for a failed read as well as the one they preferred: 'No trader, no matter how good, has 100% accuracy.'
◆ Interactive Lab
Open in new tab ↗Drive the order book yourself
Three million in buying looked persuasive until Bitcoin fell anyway. We came back to that price response throughout the stream, whether Fahad was reading a footprint or setting conditions at VWAP. His bearish BTC bias did not make every red candle a short, and 82,434 was not a buy without the candle he wanted to see. He also asked chat to think about what would happen if the analysis failed. That left us with a plan we could test against price, rather than a volume print or a call to follow blindly. Join the Hitpoint community for live market coverage and real-time trade alerts.
Watch the full stream: How to Read Bitcoin Order Flow Before a Short on YouTube
Disclaimer: This article is for educational purposes only and is not investment advice. Crypto assets are unregulated in India, are highly volatile, and can lose value rapidly; there is no established investor-protection or grievance-redressal mechanism for them. Trading With Sidhant LLP is not a SEBI-registered Investment Adviser or Research Analyst, and nothing here constitutes a recommendation to buy or sell any asset. Income from virtual digital assets is taxable in India at 30% plus applicable cess, with 1% TDS on transfers. Past performance is not indicative of future results. Do your own research before trading.
Frequently Asked Questions
- What does falling open interest during a Bitcoin selloff mean?
- Falling open interest means fewer positions remain open during the selloff. On the stream, Fahad paired it with falling CVD and said closing positions could explain much of Bitcoin's decline. We did not treat the drop as proof that fresh shorts had entered. Price action and a VWAP reaction still mattered to the setup.
- Can heavy buying volume be a bearish Bitcoin signal?
- Yes, heavy buying can accompany a bearish move when buyers trade aggressively and price falls anyway. Fahad's example showed three million in buying while the market dumped, leaving those buyers trapped. We checked the price response rather than labeling the volume bubble bullish. He also explained why one million in buying could accompany either a rise or a fall.
- How do market orders and limit orders affect a resistance break?
- Market buys trade into limit sell orders resting at resistance, so aggressive buying can pressure the level. Fahad illustrated that comparison with 200 units of resting sell liquidity and 751 units of delta. Those were teaching figures, not a recorded Bitcoin breakout. We would still check whether price actually moved beyond resistance before calling the level broken.
- When would Fahad cancel the Bitcoin short idea?
- Fahad would cancel the VWAP rejection short idea if Bitcoin reclaimed VWAP instead of rejecting it. He described the area between VWAP and the local high as neutral, with a move above 84,200 opening a bullish bias. We treated those as conditions discussed on the stream, not evidence that either move had already happened.
- What confirmation did Fahad want before buying near 82,434?
- Fahad wanted a strong bullish engulfing candle or pin bar near 82,434 before considering a buy. He did not treat the level alone as an entry. We also kept the failure scenario in view: if the 82,400 area gave way, Fahad identified roughly 81,530 as the next major support or liquidity area.
Share this post
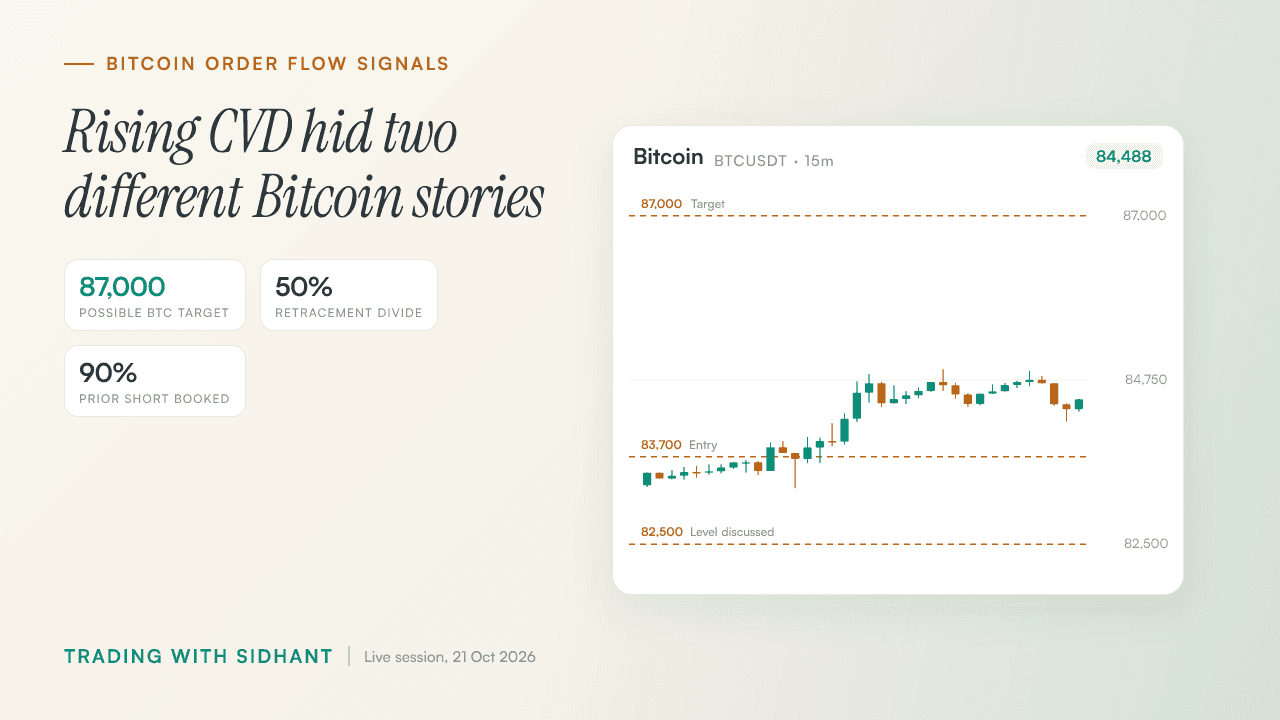
How to Read Bitcoin Open Interest and CVD Before 87,000
Rising CVD supported Fahad's Bitcoin upside bias, but a later drop in open interest changed what the buying meant.
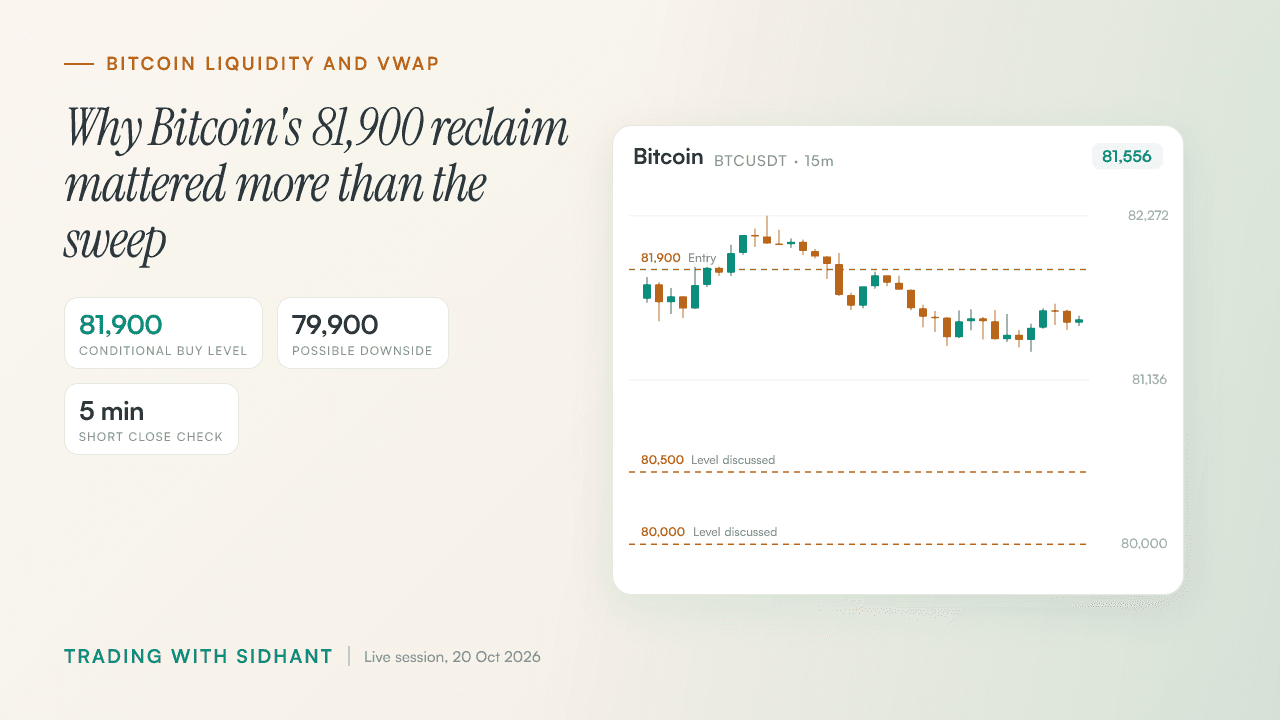
How to Trade Bitcoin Liquidity Sweeps Near 81,900
Bitcoin swept both sides of its range, but Fahad wanted an 81,900 reclaim to buy or a confirmed VWAP loss to short.
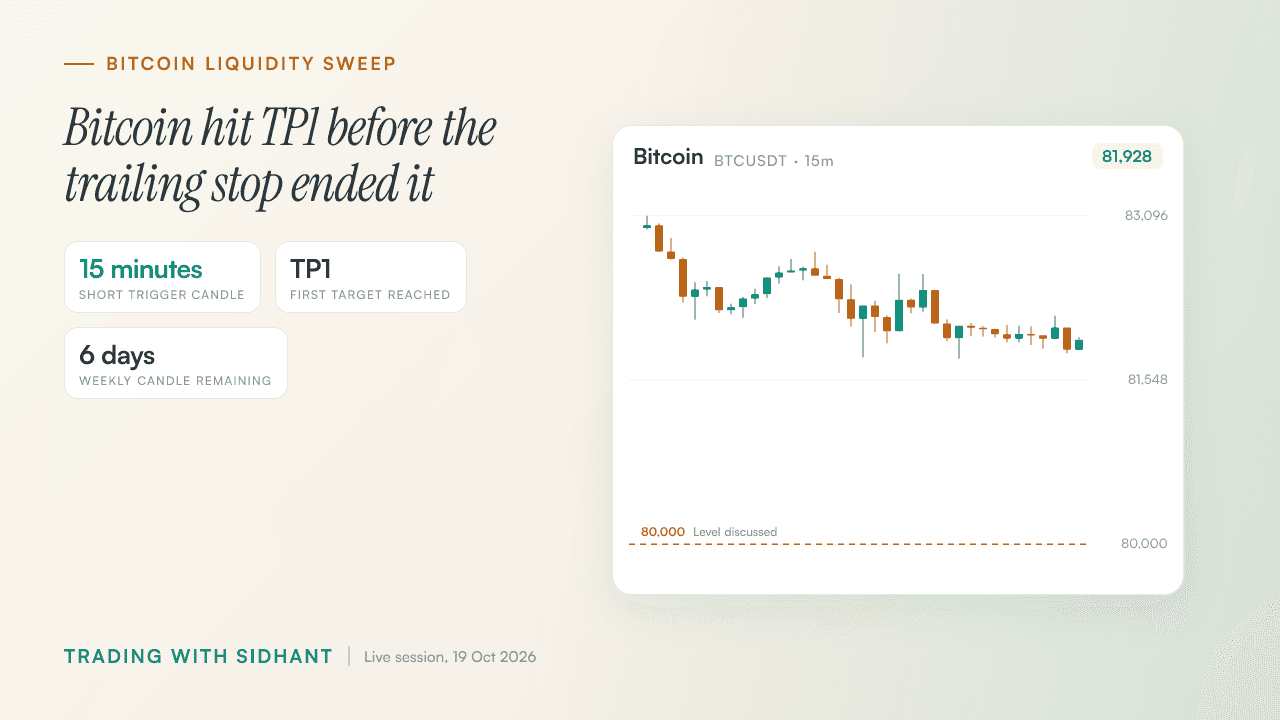
Bitcoin Liquidity Sweep Trading Strategy: TP1 and Stops
A Bitcoin short reached TP1, but the bigger lesson came from the trailing stop that ended the trade.
Get post alerts in your inbox.
New blog post? We'll email you. No spam, unsubscribe anytime.
Join our Telegram community.
Get post alerts, trading discussions, and market updates.