How to Handle Losses in Trading Without Revenge Trades
A $200 winner can outweigh a $100 loser, yet the minutes after that loss may still derail the next decision.
6 min read

A $100 loss can affect the next trade more than the one that just closed. In the video, Sidhant shows a run of losses and invites the verdict: 'Bro, this is the worst strategy.' Then he challenges it. For our team, that is the starting point for how to handle losses in trading. A $200 winner can outweigh a $100 loser in his example, but the trader still has to make a sound decision after losing.
Key Takeaways
- Grade the decision separately from its result before allowing recent losses to change the strategy.
- A win rate means little without the average win, average loss and costs beside it.
- A missed move is not an entry signal, and a larger re-entry can turn a small mistake into a much larger loss.
- The recovery timer is personal; the test is whether the next decision follows the plan rather than the loss.
- A wider sample exposes whether the equity curve came from repeatable decisions or a short run of luck.
The opening losing streak is too small to judge the strategy
A few losses cannot establish that a strategy has failed. In the video, Sidhant shows losing trades and invites viewers to reject the approach before they have enough evidence. We would first check whether the entries followed the plan. Painful outcomes and poor decisions are different findings, and each calls for a different response.
The opening verdict is harsh: 'Bro, this is the worst strategy.' It makes sense as a reaction to losing, but it is too early to assess the method.
- Trade decision: Did the entry meet the rules set before the trade?
- Outcome: Did it win or lose? Record the result without rewriting the decision afterward.
- Urge to switch: Did the loss make the strategy feel broken before the sample justified that judgment?
Sidhant says, 'As a trader, we're not reacting to our bad trades. We're reacting to the losses, and that is exactly the problem.' Two, five or even ten trades are too few to settle the question. We would scrutinize a rule-breaking winner and leave a rule-following loser in the sample rather than change methods immediately. That distinction also matters when deciding when to quit a profitable intraday strategy.
A $200 win and $100 loss make win rate only part of the answer
With an illustrative $200 win and $100 loss, a strategy can show a gross profit even when fewer than half its trades win. Sidhant uses those payoffs to challenge the chase for an 80% or 90% win rate. We would check costs and whether the payoffs repeat before trusting the calculation.
At those payoffs, one win offsets two losses. The break-even win rate is 1 ÷ 3, or 33.3%, before costs and assuming every win and loss matches the example.
Illustrative payoffs and a 100-trade calculation before costs
| Scenario | Wins and losses | Gross result | What it shows |
|---|---|---|---|
| Illustrative winner | 1 win | +$200 | One win pays twice the stated loss. |
| Illustrative loser | 1 loss | -$100 | The loss belongs in the calculation. |
| Illustrative 100-trade example | 50 wins, 50 losses | +$5,000 | 50 × $200 minus 50 × $100, before costs. |
'It was never about the outcome of a single trade,' Sidhant says. The table is a calculation, not a record of executed trades. Fees, slippage or smaller winners would change it. We would also review risk per trade, as discussed in trading Bitcoin ranges with small risk. The Axi guide to reviewing trading losses discusses sizing and plan reviews after a loss.
A missed setup can lead to unplanned entries and uneven risk
Missing a planned move can make the next entry feel urgent, even without a valid setup. In the video, a trader checks the missed move every five minutes, then chases a green candle. A further attempt to recover compounds the mistake. We would assess both entries against the plan, not against the move the trader missed.
A green candle does not supply the reason for a trade. Waiting for confirmation in trading differs from entering because a missed move still stings.
How inconsistent risk compounds an unplanned trade sequence
| Illustrative trade | Loss | Cumulative loss | Decision problem |
|---|---|---|---|
| First unplanned entry | $10 | $10 | Entering outside the plan. |
| Emotionally driven re-entry | $50 | $60 | Trying to recover with another unplanned trade. |
Sidhant compares random entries to pulling a slot-machine lever. An occasional payout can encourage another pull without validating the decision. In this illustrative sequence, the second loss is five times the first. The change in risk makes the recovery attempt more damaging than the initial entry.
The first 5 to 10 minutes after a loss need a pause
The minutes after a loss can leave a trader vulnerable to an impulsive re-entry or reversal. Sidhant uses 5 to 10 minutes as an example, not a fixed waiting rule. We would pause, check whether the next setup stands on its own, and confirm the planned risk before placing another trade.
Sidhant warns, 'The 10 minutes after taking a loss are what decide whether your account gets blown up or gets saved.' He is describing the danger of trying to recover the money immediately.
His simulator marks a red zone after a loss before returning to full decision quality. Its 100 seconds of recovery is illustrative. Sidhant says the wait could take minutes or hours, depending on the trader.
Our post-loss check:
- Pause: Step away and assess the urge to win the money back.
- Check the setup: Would this entry meet the rules without reference to the last trade?
- Confirm planned risk: Does the size match the plan rather than the frustration?
A pause cannot improve a weak setup. It can give us time to catch one before placing the trade. The CenterPoint guide to dealing with trading losses discusses stepping back and reviewing the plan; trader accountability practices can help make that review routine.
Roughly 100 trades show more than a three-trade streak
Three wins do not prove mastery, and a short drawdown does not prove failure. In the video, Sidhant zooms out to a hypothetical month of about 100 trades. We would review the result, payoff size and rule-following alongside the equity curve rather than let the latest streak decide the strategy's value.
After three wins, Sidhant jokes about becoming a full-time trader and buying an iPhone every month. He also shows how a losing run lasting a day, two days or a week can sit within a broader equity curve.
Month-end review:
- result: What did the full sample produce?
- Drawdown: How deep were the losing stretches?
- Adherence to the plan: Which trades followed the rules, regardless of outcome?
About 100 trades offers a wider view in the video; it is not a universal pass mark. We would not let trade number three decide a career, or let one painful week replace a review of the decisions behind the curve.
The hardest loss to manage may be the one that changes the next trade. Sidhant's video makes that risk visible: the $200 winner and $100 loser can work in an illustrative payoff calculation, while an unplanned recovery trade can still damage the process. We would rather identify which rule held or broke than rush to recover an amount. Give the next decision time to stand apart from the last result, then review the method across a wider sample. A losing trade can follow the plan. An impulsive winner can encourage a mistake.
Join the Hitpoint community for live market coverage and real-time trade alerts.
Watch the full video: The Harsh Truth About Why You're Still Not Profitable on YouTube
Disclaimer: This article is for educational purposes only and is not investment advice. The price levels, setups and trades described are a review of market events that have already occurred, shared to illustrate a method of analysis rather than to recommend any trade. Trading With Sidhant LLP is not a SEBI-registered Investment Adviser or Research Analyst, and nothing here constitutes a recommendation to buy or sell any security. All trading and investing carries risk of loss, and you should never risk capital you cannot afford to lose. Past performance is not indicative of future results. Please consult a SEBI-registered financial adviser before acting on any information in this article.
Frequently Asked Questions
- How can a trading strategy make money with a win rate below 50%?
- It can show a gross profit when the average winner is large enough relative to the average loser. In the video's illustration, a **$200** win offsets two **$100** losses, putting the break-even win rate at about **33.3%** before costs. We would still check whether those payoffs repeat in execution, since costs and smaller winners change the calculation.
- How long should I wait before trading again after a loss?
- Wait until you can assess a new setup against your plan without trying to recover the previous loss. Sidhant uses **5 to 10 minutes** as an example, while the simulator's **100 seconds** is only an illustration. Recovery varies by trader and may take minutes or hours. We would judge readiness by the next decision, not by a fixed countdown.
- How do I stop revenge trading after a losing trade?
- Pause before placing another trade, then check whether the proposed entry meets rules set before the loss. In the video, Sidhant shows how a missed move, an impulsive entry and an attempt to recover can feed each other. We would also confirm that the planned risk has not changed. If the next entry only makes sense as payback, it has no independent setup.
- Why does changing position size after a loss make trading riskier?
- Changing size in response to frustration can make the next loss much larger than the first. Sidhant's illustrative sequence starts with a **$10** loss and follows with a **$50** loss, totaling **$60** across two unplanned trades. The second loss is five times the first. We would assess risk against the trading plan, not the amount we want to recover.
- How many trades should I review before judging a strategy?
- Review more than a handful, and assess decisions as well as the final result. Sidhant says **two, five or ten trades** cannot establish whether a trader or strategy is good or bad; his later illustration uses about **100 trades** in a hypothetical month. That is a broader sample, not a universal pass mark. We would examine payoff, drawdown and rule-following together.
Share this post
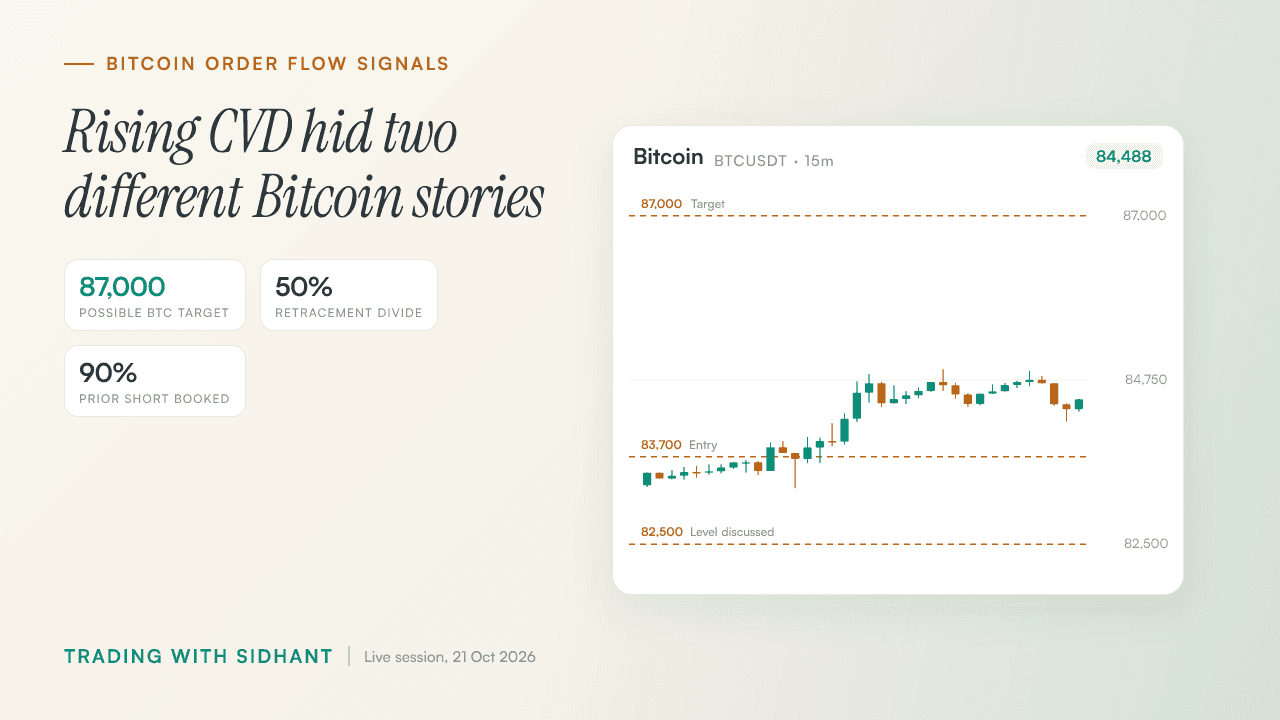
How to Read Bitcoin Open Interest and CVD Before 87,000
Rising CVD supported Fahad's Bitcoin upside bias, but a later drop in open interest changed what the buying meant.
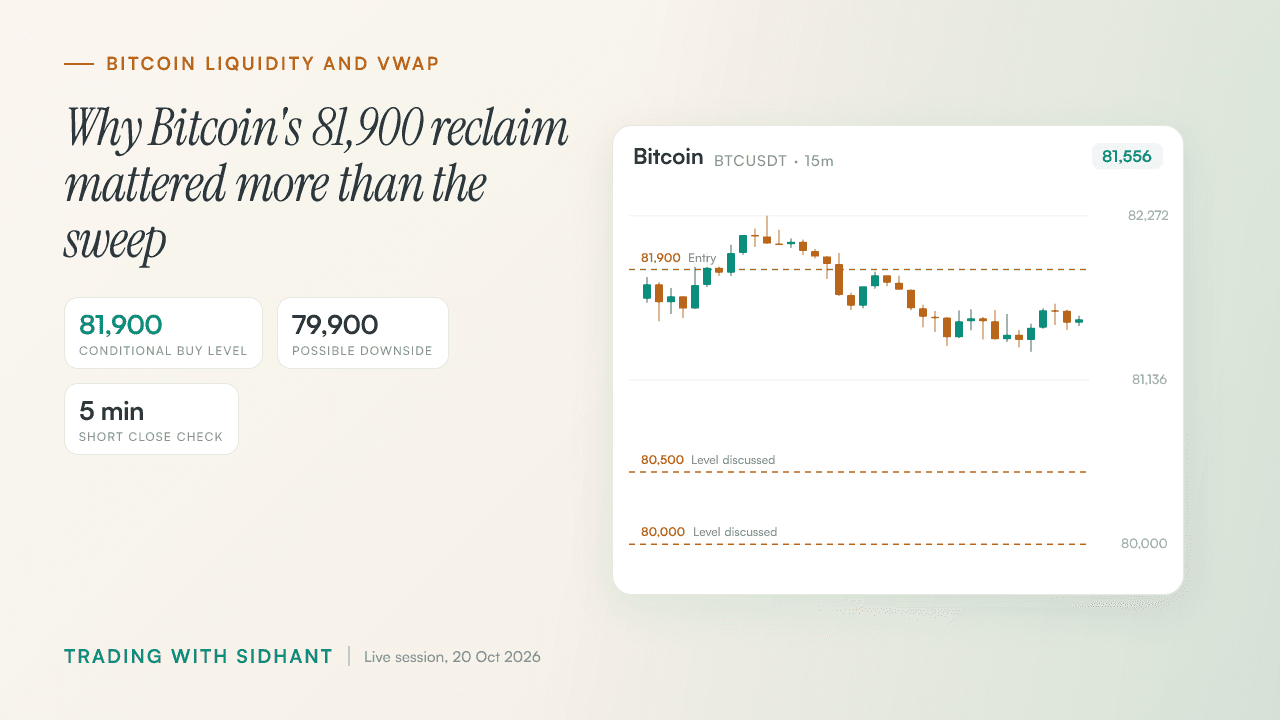
How to Trade Bitcoin Liquidity Sweeps Near 81,900
Bitcoin swept both sides of its range, but Fahad wanted an 81,900 reclaim to buy or a confirmed VWAP loss to short.
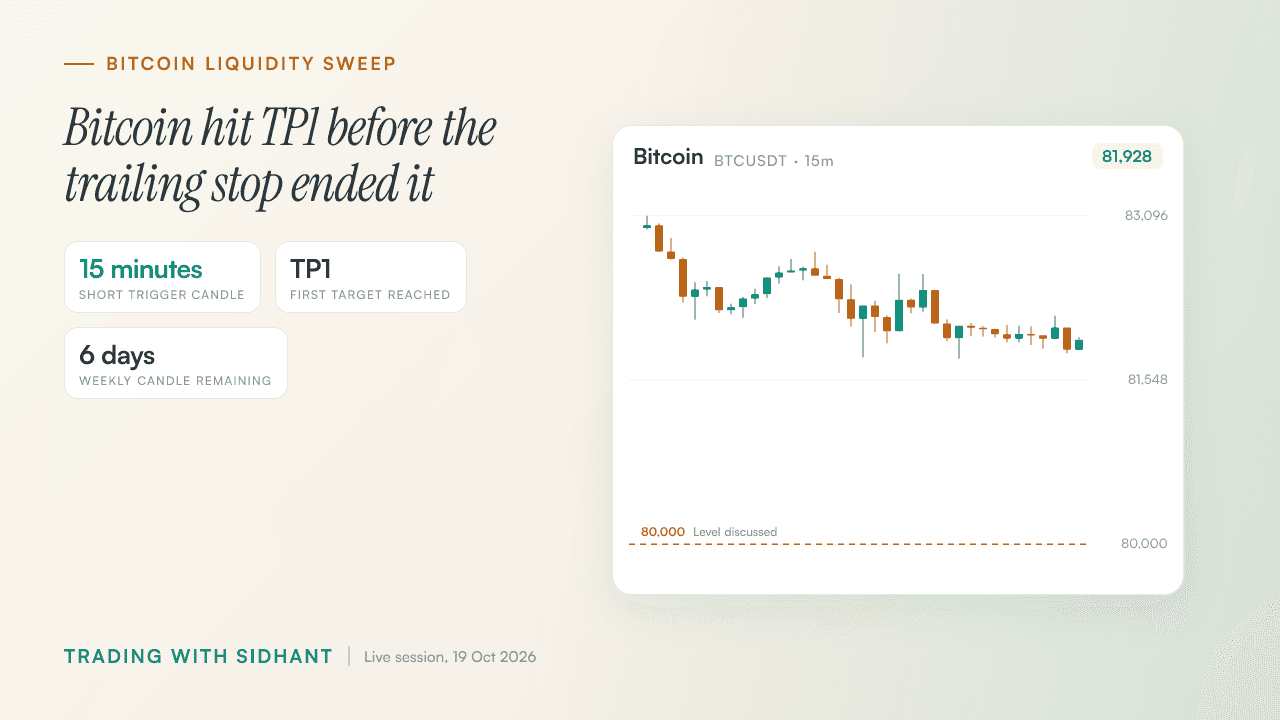
Bitcoin Liquidity Sweep Trading Strategy: TP1 and Stops
A Bitcoin short reached TP1, but the bigger lesson came from the trailing stop that ended the trade.
Get post alerts in your inbox.
New blog post? We'll email you. No spam, unsubscribe anytime.
Join our Telegram community.
Get post alerts, trading discussions, and market updates.