Bitcoin Open Interest and Price Divergence: The Long Trap
Net longs rose without a strong Bitcoin rally, leaving Fahad watching for absorption rather than assuming buyers were in control.
8 min read
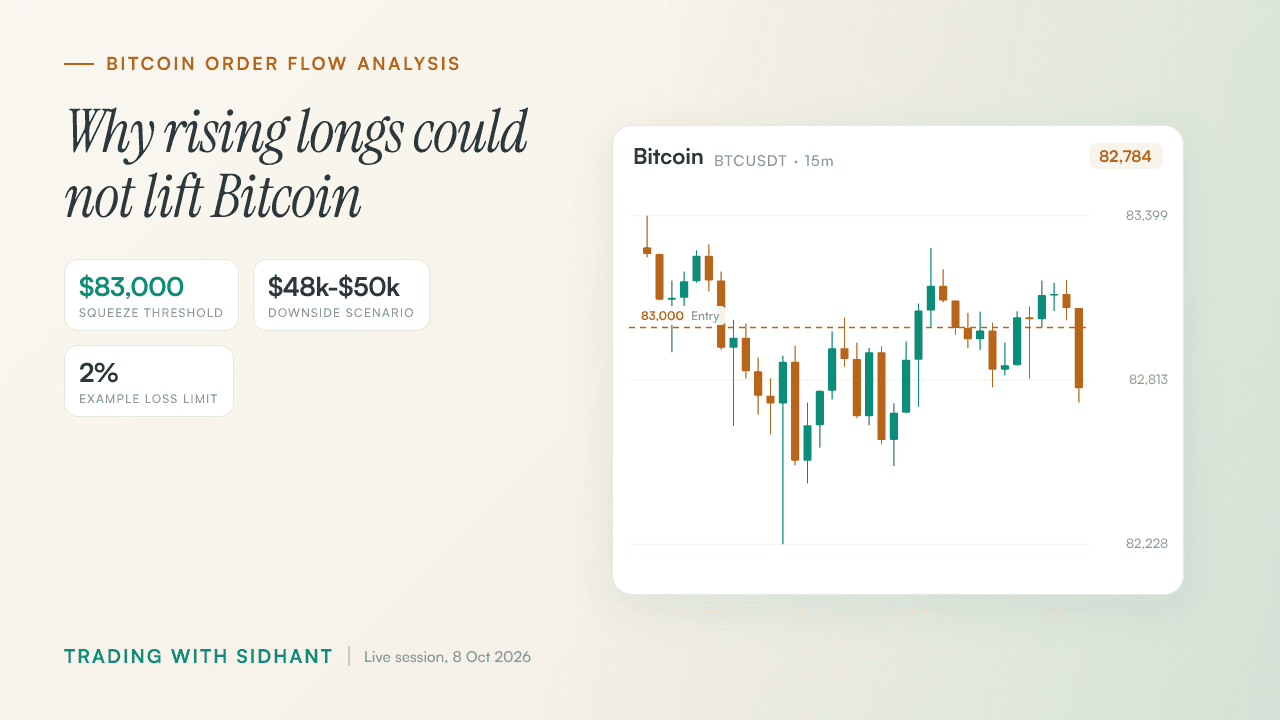
Net longs kept building, but Bitcoin would not give buyers a strong rally. That was the bitcoin open interest and price divergence Fahad examined on the stream. We had seen net shorts increase through the decline; now longs were arriving while price stalled.
Were sellers absorbing those buyers? Possibly. Fahad kept his broader bias bearish but warned that a move above $83,000 could squeeze local shorts. We watched price for evidence rather than treating the position data as a verdict.
Key Takeaways
- A bearish view still needs an invalidating level; **$83,000** was Fahad's local squeeze risk, not a Bitcoin short entry.
- Position growth shows participation; the price response shows whether those new positions are gaining ground.
- Fahad waited for candle-low breaks, then shifted the gold and silver discussion from entries to trailing after TP.
- We separated discussed conditions from confirmed entries; **oil**, HYPE and Zacks never triggered on the stream.
- A defined maximum loss kept Fahad's example trade risk finite, even when a setup looked convincing.
Bitcoin's downside bias faces a squeeze risk above $83,000
Fahad read BTC structure as bearish on the stream, but a move above $83,000 could squeeze local shorts and change the near-term picture. His $48,000 to $50,000 view was a broader downside scenario, not an entry or immediate target. The previous week's low and close were nearer liquidity references.
The bearish read had a clear challenge. Fahad said the bias remained to the downside. He did not treat that view as permission to short anywhere, and we had no specific BTC short entry or stop to report.
Bitcoin levels and what each would mean
| Reference | Fahad's reading | What remains unconfirmed |
|---|---|---|
| Above $83,000 | Possible local short squeeze | A sustained reversal |
| Previous week's low and close | Nearby liquidity references | A sweep and reclaim at a marked level |
| $48,000 to $50,000 | Broader downside scenario | Any entry or immediate trade target |
The chart below marks $83,000 on the session's 15-minute BTC candles. It shows a reference level, not a filled trade.
Fahad used sweep precisely. Price had to break below a marked level, then close back above it. If price stayed below and built structure there, the level had failed rather than been swept. Our Bitcoin liquidity sweep guide explains the distinction in more detail.
The lower scenario reflected his broader read. $83,000 was the nearby threshold that could make shorts uncomfortable.
◆ Interactive Lab
Open in new tab ↗Drive the order book yourself
Rising net longs without a rally point to possible absorption
Rising open interest showed new positions entering the market, not which side would win. Fahad saw net shorts increase during the sustained BTC decline, then net longs grow while price struggled to rally. Sellers may have absorbed those buyers. We could see the stalled price response, but not prove absorption from it alone.
More longs did not mean more lift. Fahad put it plainly: 'It's not the delta that decides whether to buy or sell. It's the market context.' We compared who was adding positions with whether price moved in their favor.
How position growth changes meaning with price action
| Observed change | Price response | Possible reading |
|---|---|---|
| Open interest and net shorts increased | BTC sustained a decline | New shorts appeared to support the move down |
| Net longs increased | Price struggled to rally | Sellers may have absorbed buyers |
| Negative delta appeared | Response depended on structure | Selling could signal weakness or trapped sellers |
That stalled-price read matters when participation grows without a rally. The Bitcoin open interest and CVD range guide examines it in more detail.
The same negative delta could support a buy in one structure and a sell in another. Fahad's footprint shorthand was to look for trapped traders at the bottom and aggressive traders at the top. He discussed 5-minute and 1-minute charts for scalping, where the reading can change quickly. The footprint delta guide explains why delta alone can mislead.
While price paused, we did not call the rising longs a confirmed trap. Buyers still had to show they could move the market.
Gold and silver shorts waited for candle confirmation
Fahad waited for gold to lose a relevant candle low rather than shorting an indecisive reaction. He used the 15-minute candle for context and a 5-minute low for confirmation. Silver needed a break of its prior candle's low or local support. Neither discussed setup came with a precise entry price.
The candle had to confirm the short. 'Without confirmation, no matter what anyone says, I'm not taking the trade,' Fahad said. He described a candle taking out the previous high, then losing its low, as a firmer short condition than a rejection alone. Our guide to trading confirmation covers that discipline.
- Gold trigger: The 15-minute reaction supplied context; a relevant 5-minute low had to break. Fahad later said the discussed short reached TP, without saying he personally entered every setup he discussed.
- Gold management: 4,110 was the next major support he identified. After TP, he discussed trailing the stop above 4,120 instead of naming another fixed target.
- Silver trigger: Losing local support or breaking the prior candle's low could offer a short or re-entry. Fahad gave no exact price.
- Silver management: He said the discussed short reached TP and favored trailing over setting a further target.
The chart below marks 4,110 and 4,120 on the gold session candles. They show the support and later stop area discussed on the stream, not proof that 4,110 was the TP already reached.
We kept the promising reaction separate from the trigger. An uncertain candle could not do the work of confirmation.
◆ Interactive Lab
Open in new tab ↗Drive the order book yourself
Solana needed a level break; oil and altcoin ideas stayed untriggered
Fahad considered a SOL short only if a level marked from earlier reversals gave way, with prior lows as his first area of interest. Oil needed a strong close above its volume-area high for a risky long. HYPE and Zacks offered possible shorts, but neither had a confirmed entry.
A marked chart was not a filled order. We kept the conditions separate:
- SOL: Fahad used the 30-minute decline and several earlier reversals to mark the level. He gave no exact entry, stop or target price. He later discussed trailing a position after TP, without establishing who had entered it.
- Oil: A strong candle close above the volume-area high was required for the long. Fahad found the stop difficult to place, and the condition did not trigger.
- HYPE: Fahad considered a short, but the rejection or trigger he wanted did not appear.
- Zacks: He saw a possible short but found no entry.
Separate reporting on SOL reclaiming $100 after a drop describes a different price snapshot. A SOL price report citing a 37% 30-day decline and roughly $157.90 describes another. Neither gives the unnamed SOL trigger from this stream, so we did not substitute an outside price for Fahad's marked level.
With BTC moving sideways, Fahad questioned the value of opening random altcoin charts. Another ticker would not supply the missing confirmation.
A fixed loss limit matters more than a perfect entry
Fahad treated a viewer's account blown on one trade as a risk-management problem before an entry problem. He gave 2% as an example of a maximum loss, not a universal position size. With a small account, he put skill and accuracy ahead of profit and favored trailing open winners over guessing fresh targets.
One trade should not take the whole account. The viewer's story changed the tone of the stream. Fahad offered no special entry to fix the damage: 'Choose accuracy. Choose the skill. Master it, then grow your account, then think about profit.'
Fahad said he had traded for eight years and estimated that it took about 9 to 10 months to become profitable. He recalled early losses of roughly Rs 15,000 to Rs 20,000. Those were his recollections, not a timetable for other traders.
We took three practical rules from that exchange:
- Define the loss first: Set a maximum amount before entering. 2% was Fahad's example, not a rule for every account.
- Wait for the trigger: A marked level, an indecisive candle or rising open interest did not complete a setup on its own.
- Manage an open winner: After a discussed TP, Fahad preferred trailing the stop to naming another target without a basis.
The Hitpoint trader accountability guide fits this exchange: a trader needs a rule that still applies after a frustrating loss. Fahad also pushed back on reversing every stopped-out trade. Changing sides without controlling risk can leave the account exposed again.
Bitcoin sat still while net longs kept growing. We could see the new positions, but Fahad wanted price to show whether buyers had control. He also kept $83,000 in view because shorts faced squeeze risk. On gold, he waited for a candle-low break; the oil long never got its required close. Late in the stream, as price stalled, we stopped looking for fresh trades rather than filling the pause with new targets. The distinction between a condition and an entry held across every chart we discussed. Join the Hitpoint community for live market coverage and real-time trade alerts.
Watch the full stream: Bitcoin Open Interest and Price Divergence: The Long Trap on YouTube
Disclaimer: This article is for educational purposes only and is not investment advice. The price levels, setups and trades described are a review of market events that have already occurred, shared to illustrate a method of analysis rather than to recommend any trade. Trading With Sidhant LLP is not a SEBI-registered Investment Adviser or Research Analyst, and nothing here constitutes a recommendation to buy or sell any security. Investments in securities markets are subject to market risks; read all the related documents carefully before investing. Past performance is not indicative of future results. Please consult a SEBI-registered financial adviser before acting on any information in this article.
Frequently Asked Questions
- Why can Bitcoin fall when open interest and net longs are rising?
- Bitcoin can fall because new long positions do not guarantee that buyers can push price higher. On the stream, Fahad saw net longs grow while price struggled to rally, raising the possibility that sellers were absorbing those buys. Open interest showed participation; the stalled price response made us question who had control.
- What would a move above $83,000 mean for Fahad's Bitcoin outlook?
- A move above **$83,000** could trigger a local short squeeze and challenge Fahad's near-term bearish read. He said it might also suggest a reversal, but a squeeze alone would not confirm one. His **$48,000 to $50,000** downside view was a broader scenario, with no specific Bitcoin short entry or stop stated.
- Does negative delta always mean traders should sell?
- No. Fahad said market context, not delta alone, determines how to read selling. The same negative delta can accompany weakness or appear where sellers are trapped and price refuses to move lower. We compared the footprint reading with structure and price response before drawing a directional conclusion.
- What confirmed the gold and silver short setups?
- Candle-low breaks supplied the confirmation Fahad wanted, rather than an indecisive rejection. For gold, he used the **15-minute** reaction and looked for a relevant **5-minute** candle low to break. For silver, he discussed a break of the prior candle's low or local support. He later said the discussed shorts reached TP, without claiming he personally entered every setup.
- How much should a trader risk on one trade?
- Fahad gave **2%** as an example of a predefined maximum loss, not a universal amount for every trader or account. His point followed a viewer's account loss on one trade: even a valid-looking entry cannot make up for an undefined loss limit. He urged traders to build skill and accuracy before chasing profit.
Share this post
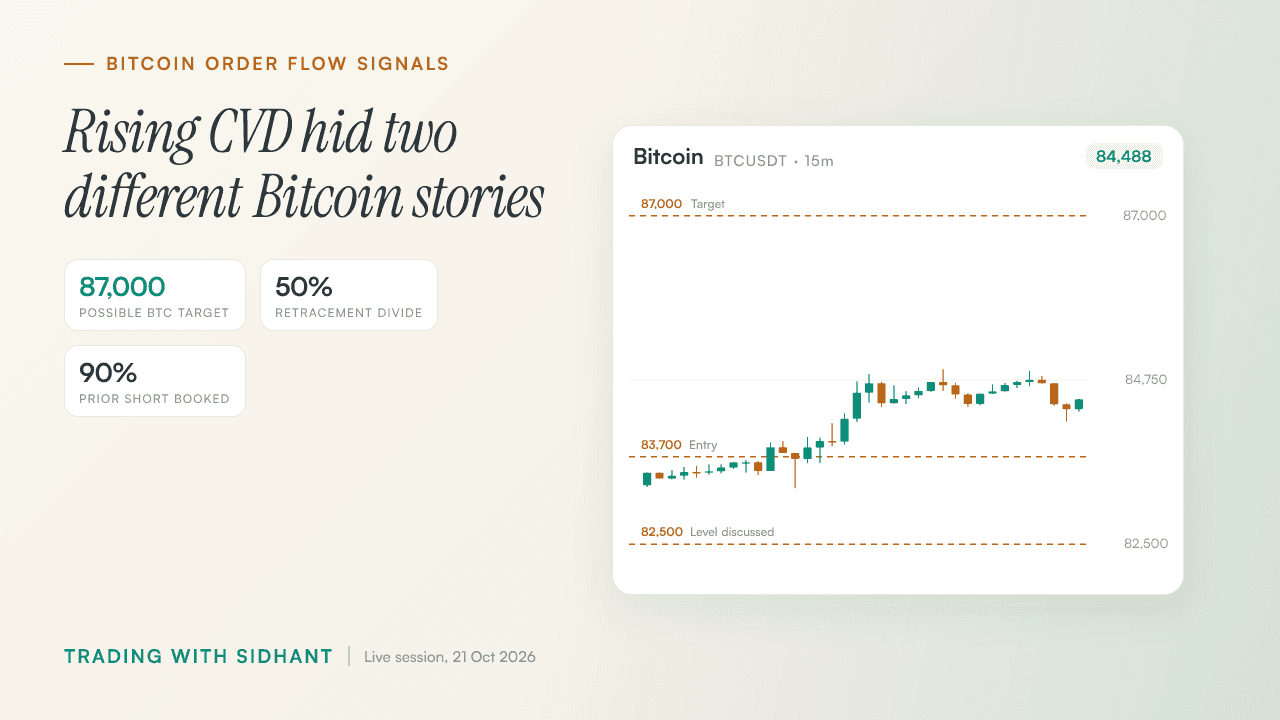
How to Read Bitcoin Open Interest and CVD Before 87,000
Rising CVD supported Fahad's Bitcoin upside bias, but a later drop in open interest changed what the buying meant.
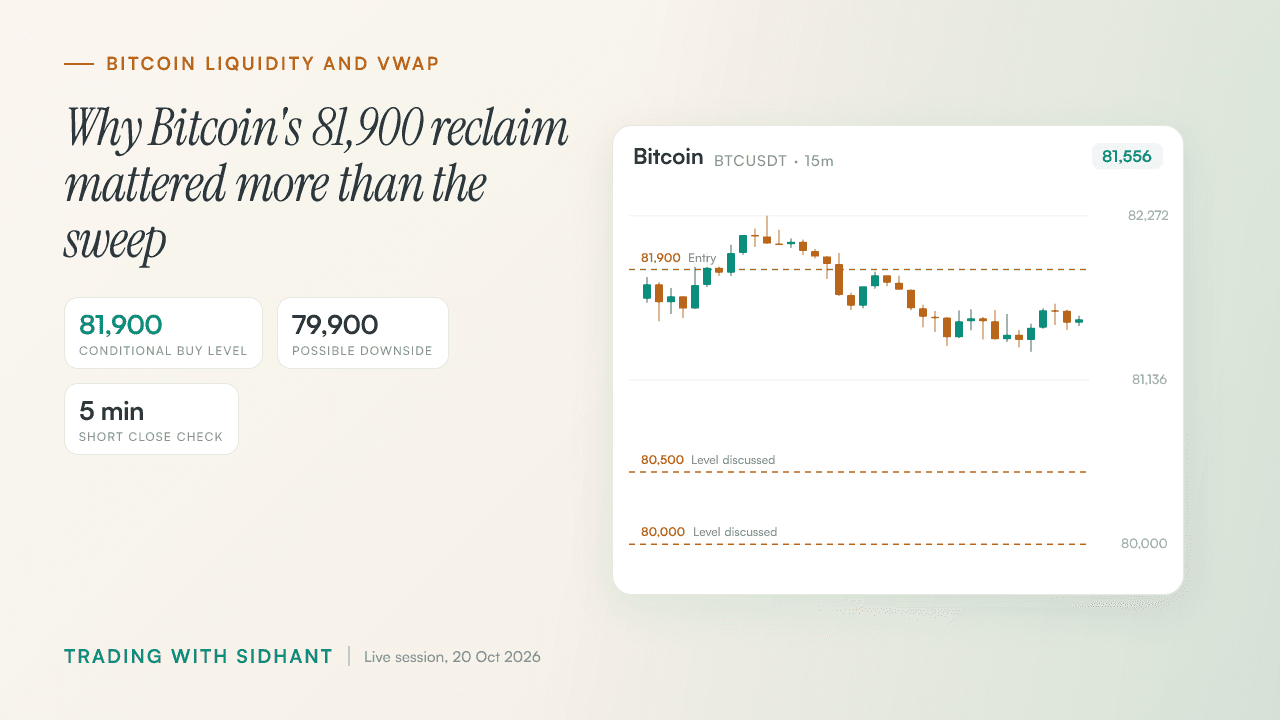
How to Trade Bitcoin Liquidity Sweeps Near 81,900
Bitcoin swept both sides of its range, but Fahad wanted an 81,900 reclaim to buy or a confirmed VWAP loss to short.
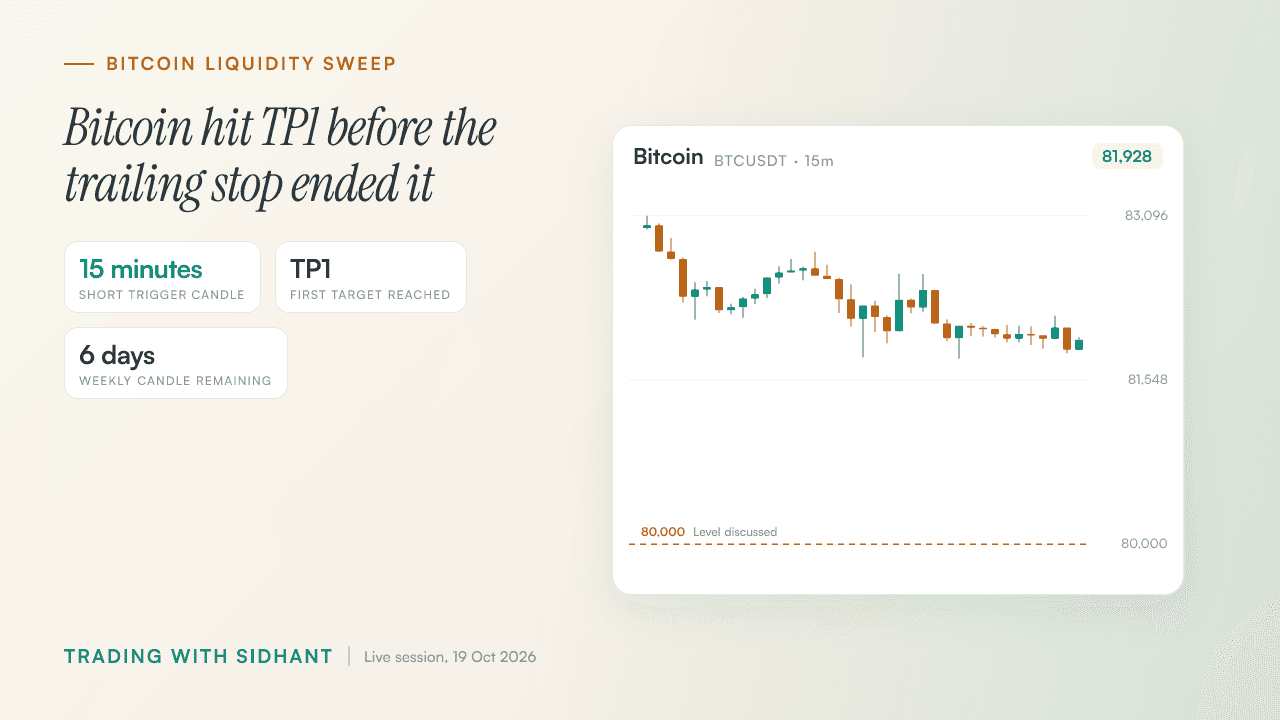
Bitcoin Liquidity Sweep Trading Strategy: TP1 and Stops
A Bitcoin short reached TP1, but the bigger lesson came from the trailing stop that ended the trade.
Get post alerts in your inbox.
New blog post? We'll email you. No spam, unsubscribe anytime.
Join our Telegram community.
Get post alerts, trading discussions, and market updates.