Master Bitcoin Trading Strategy for Indian Retail Traders
Discover key Bitcoin trading strategies for Indian traders with Fahad's expert insights.
12 min read
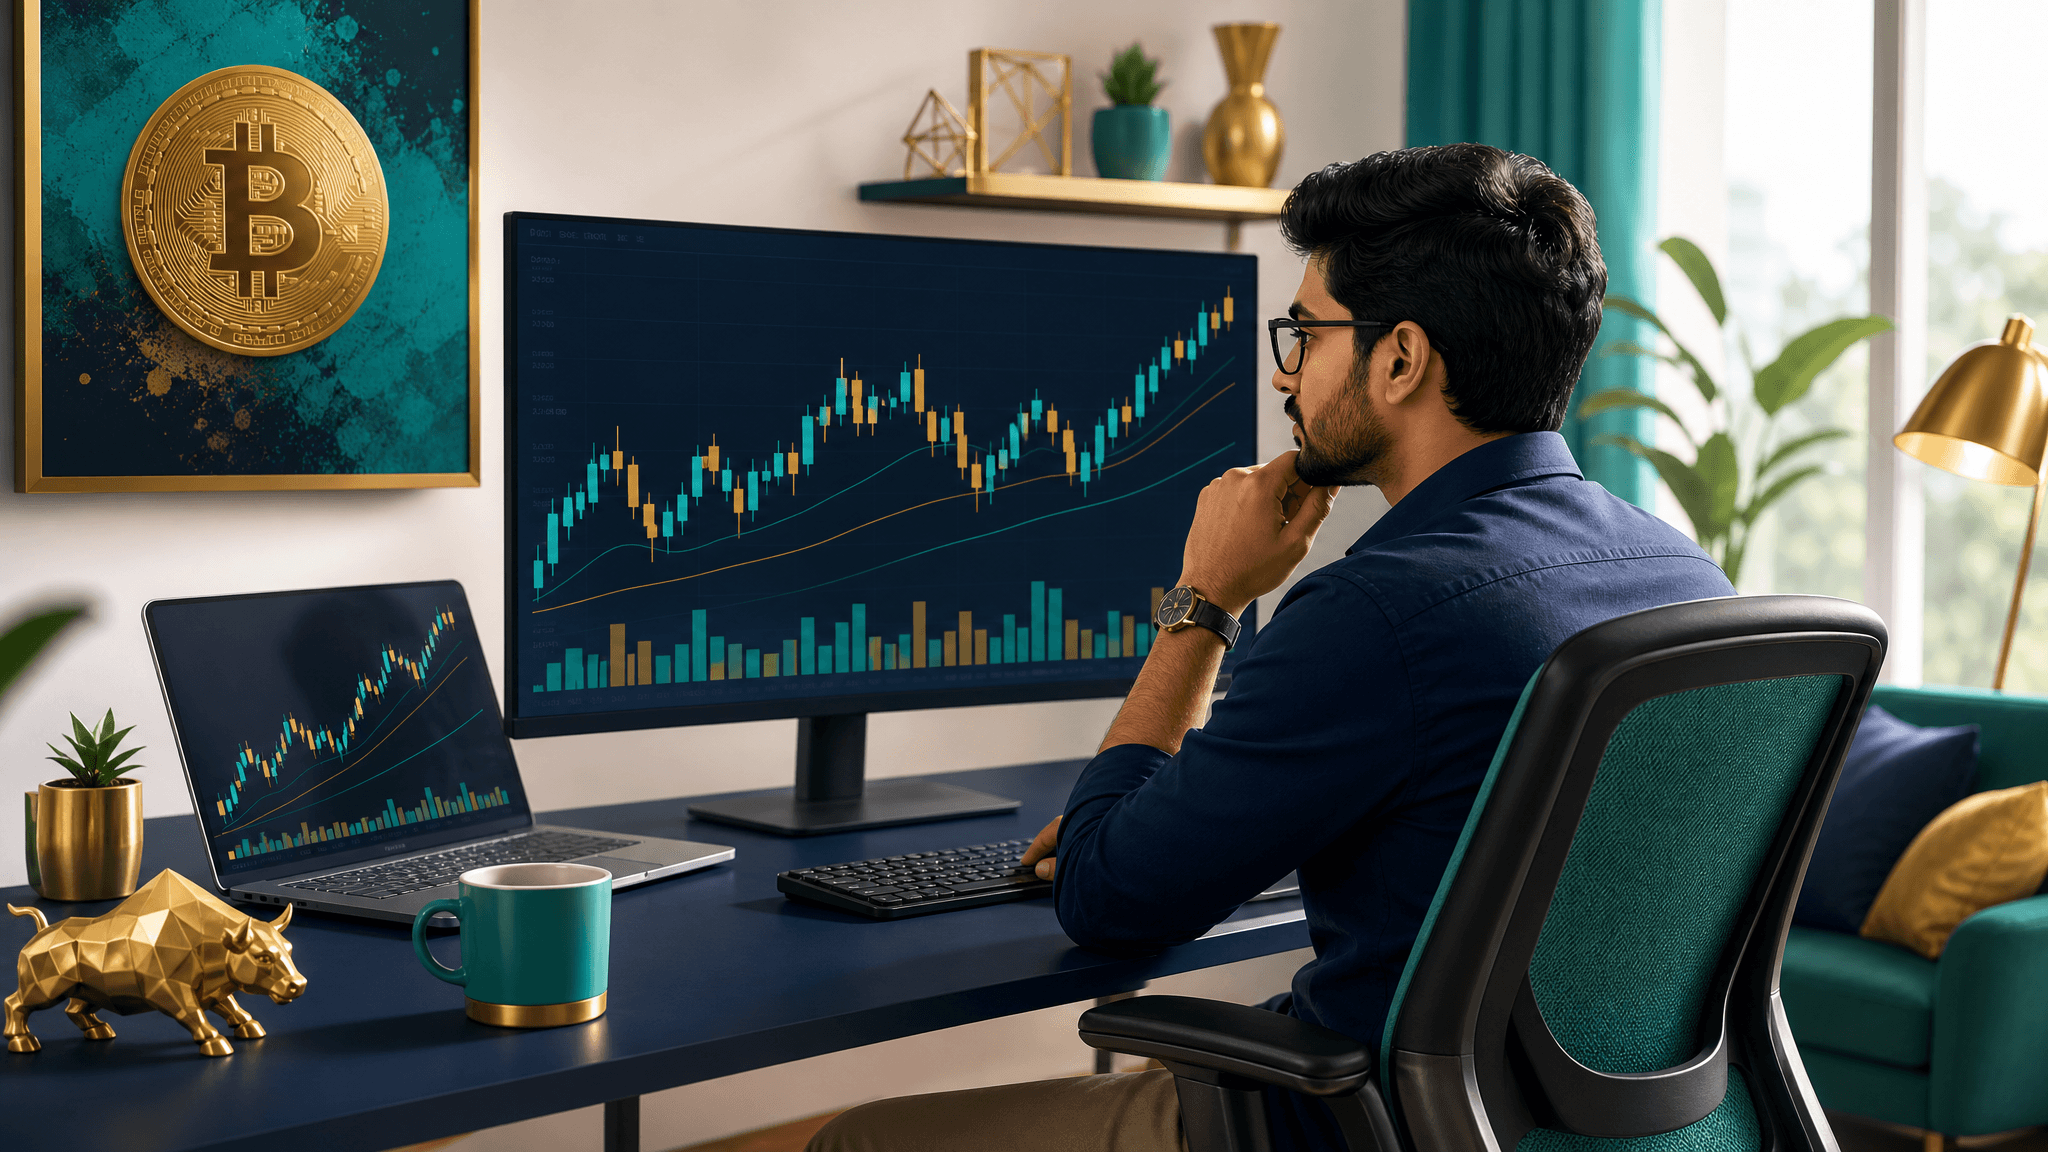
Fahad called a short on BTC targeting 64,600 with a stop at 64,400, and the reasoning behind that call is exactly what this post is about. A bitcoin trading strategy for Indian market participants isn't just about picking levels. It's about reading candle formations, understanding volume distribution, and keeping your head straight when the market is doing everything it can to shake you out. We covered all of this live on stream, and the community voted on which assets to dig into first. The energy in the room was real. As Fahad put it at the open, "I hope you guys are having a great day, trading wise and otherwise as well." This post breaks down the full framework: strategy development, candle reading, VVP application, and the probability mindset that separates consistent traders from the ones who blow up.
Key Takeaways
- Define your stop before your entry. Position size and trade logic flow from that single discipline.
- A 15-minute candle *close* above a key level is the confirmation signal. Wicks don't count.
- Loss aversion disguised as patience is the single most destructive psychological pattern in retail Bitcoin trading.
- VVP reclaim on a 15-minute close is the team's entry confirmation. Anything less is just noise.
- A 55% win rate with a 2:1 reward-to-risk ratio beats a 70% win rate at 1:2. Know your numbers before entering.
How to Develop a Bitcoin Trading Strategy?
Developing a Bitcoin trading strategy involves understanding price movements, using technical analysis, and applying risk management skills. Our team provides insights on these elements, and the key word here is system. Not tips. Not signals. A repeatable process you can apply session after session, whether Bitcoin is trending cleanly or chopping everyone to pieces.
So basically, what does that process actually look like in practice?
First, you need a read on Bitcoin price movements at a structural level. Are we in a trending phase or a range? On the stream, Fahad identified that BTC had hit a resistance area and was showing signs of exhaustion. That structural read came before any entry decision. The trade idea (short, targeting 64,600, stop at 64,400) only made sense because the broader context supported it. Without that context, it's just a random bet.
Second, technical analysis is your filter, not your oracle. Candle formations, volume patterns, and key levels narrow the field of possibilities. They don't guarantee anything. As Fahad said on stream, "trading is all about probabilities, right?" That's the frame. You're not looking for certainty. You're looking for a setup where the math is in your favour.
Third (and this is where most retail traders fall short), risk management skills are non-negotiable. The stop at 64,400 wasn't arbitrary. It was placed at a level where, if price reclaimed it, the thesis was invalidated. That's disciplined risk management: define the point where you're wrong before you enter.
Here's the thing: a lot of Indian retail traders build strategies backwards. They find a setup they like, enter, and then figure out where to put the stop. That's backwards. The stop defines the trade. The position size follows from the stop. Everything else is execution.
For anyone serious about building a trading strategy with structure and discipline, the framework is the same regardless of the asset. Identify the context, filter with technicals, size according to risk. Repeat.
Our team's approach on every stream is to make that process visible and auditable. You can see the reasoning, poke holes in it, and learn from both the wins and the misses. That's the whole point.

Why Candle Formations Matter in Bitcoin Trading?
Candle formations offer insights into potential market movements by showing the buying and selling pressure over specific periods. Our team explains how candle formations can guide trading decisions, and specifically why reading them wrong is one of the fastest ways to lose money in a market as volatile as Bitcoin.
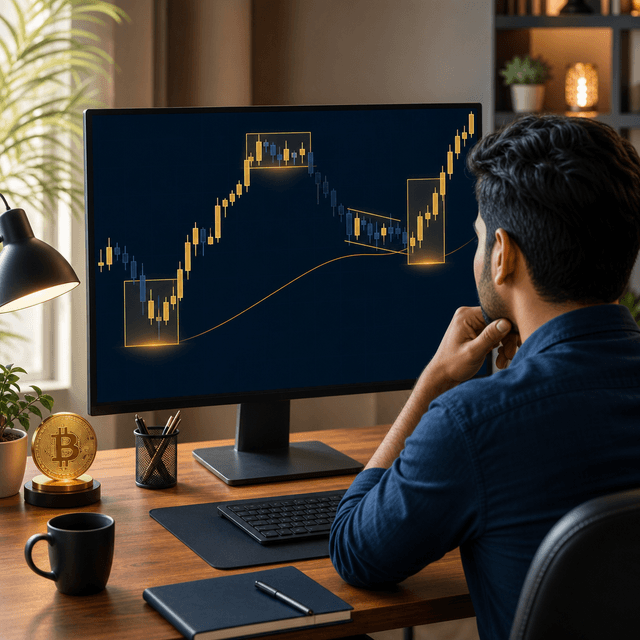
Every candle tells a story. The body, the wicks, the relationship to the candle before it. All of it is data. A long upper wick at resistance tells you sellers came in hard and rejected the move. A tight-bodied candle with small wicks at a key level tells you the market is coiling. These aren't decorative patterns. They're the footprint of actual buying and selling pressure playing out in real time.
On the stream, Fahad was specific: "If I get into the specific type of candle... it looks pretty good." That's not vague appreciation. That's pattern recognition built from hours of screen time. And the benchmark he set for confirmation was equally specific: "you need at least 15 minutes, the candle that is made should reclaim the VVP." A 15-minute candle close above the Variable Volume Profile level. Not a wick. A close. That distinction matters enormously.
Why 15 minutes? Because shorter timeframes generate noise. A 1-minute or 3-minute candle reclaiming a level can reverse instantly. A 15-minute candle close is a much stronger signal that the market has actually accepted price at that level. It's the difference between a test and a commitment.
Honestly, I don't really like this current price action. That's a phrase you'll hear Fahad say when the candles are ambiguous and the setup isn't clean. And that's the right call. Not every candle formation is tradeable. The discipline is knowing when to act and when to sit on your hands.
For traders who want to go deeper on reading market trends through price action, Fahad's full breakdown on price action principles is worth the read. The framework translates directly to candle-by-candle analysis on BTC.
- Bullish engulfing at support: potential reversal signal, wait for volume confirmation
- Bearish pin bar at resistance: rejection of higher prices, watch for follow-through
- Inside candle at a key level: compression before a move, direction TBD
- 15-minute close above VVP: the confirmation bar our team uses for entries
Pattern recognition is a skill. It compounds over time. The more charts you watch, the faster the reads come.
The Role of Psychology in Trading Bitcoin
Trading psychology focuses on the emotional and mental factors that impact trading decisions. By understanding these elements, traders can sharpen decision-making and reduce emotional trading risks. In Bitcoin, where moves of 5-10% in a day are completely normal, the psychological pressure is relentless.
Fahad addressed this directly on stream: "Trading is something I can see get the fact. I understand that very well." That's conviction speaking. But conviction doesn't come from nowhere. It comes from having done the work, seen the patterns, and built enough experience to trust your read even when the market is making you uncomfortable.
Here's the thing about Indian retail traders specifically: research on cryptocurrency trading and mental health factors shows that loss aversion, confirmation bias, and overconfidence are the three most common psychological traps. Loss aversion makes you hold losing trades too long. Confirmation bias makes you ignore signals that contradict your thesis. Overconfidence makes you size too large after a winning streak.
All three of these are account killers.
Wait, actually, the most dangerous one for most traders is loss aversion. Because it feels like patience. "I'll hold a bit longer, it'll come back." That's not patience. That's denial. Real patience is sitting in cash when there's no clean setup. Holding a losing trade past your stop is just emotional decision-making with a patience label on it.
The antidote is process. When you have a defined system (entry criteria, stop placement, target levels), the emotional component shrinks because the decisions are already made. You're not deciding in the heat of the moment. You're executing a plan.
Fahad's approach on stream is a live demonstration of this. He states the thesis, places the levels, and then watches. No second-guessing. No moving stops because the trade is uncomfortable. The plan is the plan.
For traders working on accountability structures that reinforce disciplined trading habits, the psychological side is half the battle. The technical setup gets you to the door. Psychology determines whether you walk through it correctly.

Understanding VVP in Bitcoin Trading
Variable Volume Profile (VVP) helps traders understand volume distribution across different price levels, improving entry and exit points. Our team explains its application in Bitcoin trading, and if you've never used it before, it's genuinely one of the most useful tools for understanding where the market actually cares about price.
So basically, here's what VVP does: it shows you where the most trading activity occurred over a given period. High-volume nodes are price levels where a lot of transactions happened. Low-volume nodes are areas where price moved through quickly. The market tends to gravitate toward high-volume areas (they act like magnets) and move fast through low-volume areas (thin air between levels).
For entry and exit points, this is actionable intelligence. If price is sitting at a high-volume node and forming a clean candle pattern, that's a high-probability setup. If price is in a low-volume zone, expect fast, volatile moves in either direction. Not the place to be sizing up.
Fahad's specific rule on stream: the candle needs to reclaim the VVP before you treat a level as confirmed. That means price has to trade above (or below, for shorts) the key volume distribution level and close there on a 15-minute timeframe. A wick through it doesn't count. Price accepted above it counts.
For the BTC short setup Fahad identified, the logic was exactly this. Price had failed to reclaim a key VVP level after reaching resistance. That failure was a signal that sellers were in control and a corrective move toward 64,600 was the higher-probability outcome.
- High-volume node: strong support/resistance, expect consolidation or reversal
- Low-volume node: thin area, price moves fast, be cautious with stops
- VVP reclaim on 15m close: entry confirmation for our team's setups
- VVP rejection: potential signal for the opposite direction
You know what I mean? The VVP isn't magic. It's a map of where the market has done business. Use it to understand context, not as a standalone signal.
For traders who want to see how liquidity levels interact with volume profile in live BTC setups, that framework complements VVP analysis directly. The two tools together give you a much sharper read on where price is likely to find support or face rejection.
Probabilities in Bitcoin Trading Decisions
Understanding and applying probabilities is essential in trading as it helps in evaluating potential outcomes and making informed trading decisions based on calculated risks. This isn't abstract math. It's the mental model that separates traders who last from traders who blow up in their first six months.
Fahad put it plainly on stream: "Trading is literally a game of probability, you know what I mean?" And he meant it in the most practical sense. Every setup has a probability attached to it. Not a precise number (you're not calculating a binomial distribution before every trade). But a rough sense of: is this a 60-40 situation in my favour, or am I reaching for a 40-60 setup because I'm bored?
The FOMC calendar, current market conditions of Bitcoin and gold, TPO levels. All of these are inputs into the probability assessment. A setup that looks clean in isolation looks very different if you're trading into a major macro event. Context shifts probabilities.
Look, the way our team thinks about evaluating outcomes is simple: we're not trying to win every trade. We're trying to make sure that when we're right, we make more than we lose when we're wrong. That's it. A 55% win rate with a 2:1 reward-to-risk ratio is a profitable system. A 70% win rate with a 1:2 reward-to-risk is a losing system. The math matters more than the win rate.
Calculated risks means knowing your numbers before you enter. What's the probability this setup plays out? What's the reward if it does? What's the loss if it doesn't? If you can't answer all three before you click the button, you're not trading. You're gambling.
For a deeper look at how bearish setups get structured around probability and risk in Bitcoin, the same framework applies. The direction changes; the probability thinking doesn't.
Comparing Trading Scenarios Based on Probability
| Scenario | Probability | Expected Outcome |
|---|---|---|
| BTC short at resistance, VVP rejection confirmed | ~65% | Move toward target at 64,600, stop at 64,400 |
| BTC long at support, VVP reclaim on 15m close | ~60% | Bounce trade, tight stop below VVP node |
| BTC trade into FOMC event without confirmation | ~40% | High uncertainty, event risk dominates price action |
| Counter-trend trade without volume confirmation | ~35% | Low-probability, high-risk, avoid unless exceptional setup |
| Range trade at high-volume node with clean candle | ~55% | Mean reversion play, moderate probability, manageable risk |
These aren't fixed numbers. They're illustrative. The point is to build the habit of assigning a probability before entering. That habit alone will change how you trade.
That stream covered a lot of ground, from the BTC short setup at resistance to the deeper frameworks behind why we trade the way we do. Here's what to carry forward:
- Strategy first, trade second. Identify context (trending or ranging), filter with technicals, size according to your stop. In that order.
- Candle closes matter more than wicks. A 15-minute close above or below a VVP level is the confirmation signal our team uses. Wicks are noise.
- Psychology is the edge most traders ignore. Loss aversion, confirmation bias, overconfidence. All three are account killers. Process is the antidote.
- VVP maps where the market cares about price. High-volume nodes attract price; low-volume zones are fast and dangerous. Use VVP for context, not as a standalone trigger.
- Probability thinking beats prediction. You don't need to be right 70% of the time. You need your wins to be bigger than your losses, consistently.
Fahad wrapped the session the same way he opened it, with genuine appreciation for the community that shows up and does the work. "Thank you so much for sharing your time with me." That's the energy here.
Join the Hitpoint community for live market coverage and real-time trade alerts, where the analysis is transparent, the reasoning is auditable, and the learning never stops.
Watch the full stream: Master Bitcoin Trading Strategy for Indian Retail Traders on YouTube
Disclaimer: This article is for educational purposes only and is not investment advice. Crypto assets are unregulated in India, are highly volatile, and can lose value rapidly; there is no established investor-protection or grievance-redressal mechanism for them. Trading With Sidhant LLP is not a SEBI-registered Investment Adviser or Research Analyst, and nothing here constitutes a recommendation to buy or sell any asset. Income from virtual digital assets is taxable in India at 30% plus applicable cess, with 1% TDS on transfers. Past performance is not indicative of future results. Do your own research before trading.
Frequently Asked Questions
- What is a good Bitcoin trading strategy for Indian traders?
- A solid bitcoin trading strategy for Indian market participants combines structural context, technical analysis, and strict risk management. Identify whether BTC is trending or ranging first. Then use candle formations and VVP levels to filter setups. Define your stop before entering. That single discipline separates consistent traders from those who blow up. Probability thinking, not prediction, drives the approach.
- How do candle formations affect Bitcoin price analysis?
- Candle formations reveal the balance of buying and selling pressure at specific price levels. A bullish engulfing at support signals potential reversal; a bearish pin bar at resistance signals rejection. Our team's specific rule: a 15-minute candle *close* above a key level is required for confirmation, not a wick. This filter eliminates a large portion of false signals.
- What role does psychology play in trading Bitcoin?
- Psychology determines whether a technically sound strategy actually gets executed correctly. Loss aversion causes traders to hold losing positions past their stop. Confirmation bias filters out contradicting signals. Overconfidence leads to oversizing after winning streaks. Research on cryptocurrency trading confirms these are the dominant mental health factors affecting retail traders. A defined process, with entry, stop, and target set in advance, reduces emotional interference significantly.
- Why is VVP important in Bitcoin trading strategies?
- Variable Volume Profile shows where the most trading activity occurred, mapping the levels where the market has historically done business. High-volume nodes act as strong support and resistance. Low-volume zones see fast, volatile price movement. Our team uses VVP reclaim on a 15-minute close as the entry confirmation signal for BTC setups. It confirms that price has been accepted at a level, not just tested.
- How can Indian traders manage risk in Bitcoin trading?
- Risk management starts with defining the stop before the entry. Position size follows from the stop distance and the maximum capital you are willing to lose on the trade. A 2:1 reward-to-risk ratio means a 55% win rate produces a profitable system over time. Avoid trading into high-uncertainty events like FOMC without confirmation. Never move a stop wider because a trade is uncomfortable. That is loss aversion, not strategy.
Share this post

How to Use Direction Area Trigger in Nifty Trading
A Nifty short near 24,000 needed more than a pin bar: daily bias, a defined area and footprint evidence had to agree.
Bitcoin Order Flow Analysis After a Rally
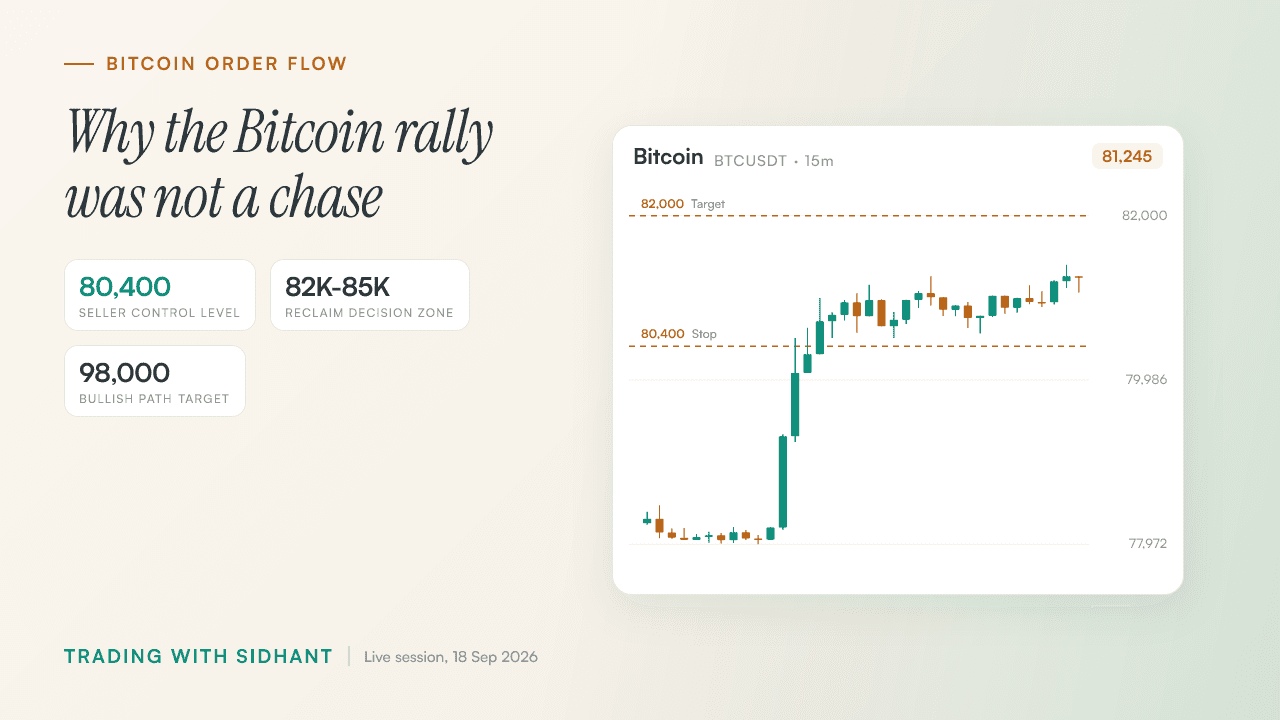
Bitcoin had already rallied, so Fahad used 80,400, delta and seller exhaustion to explain why waiting beat a FOMO entry.
When to Quit a Profitable Intraday Strategy
Rs 12 lakh in profit looked different after Sidhant counted the 1,500 hours and the freedom the strategy had consumed.
Get post alerts in your inbox.
New blog post? We'll email you. No spam, unsubscribe anytime.
Join our Telegram community.
Get post alerts, trading discussions, and market updates.